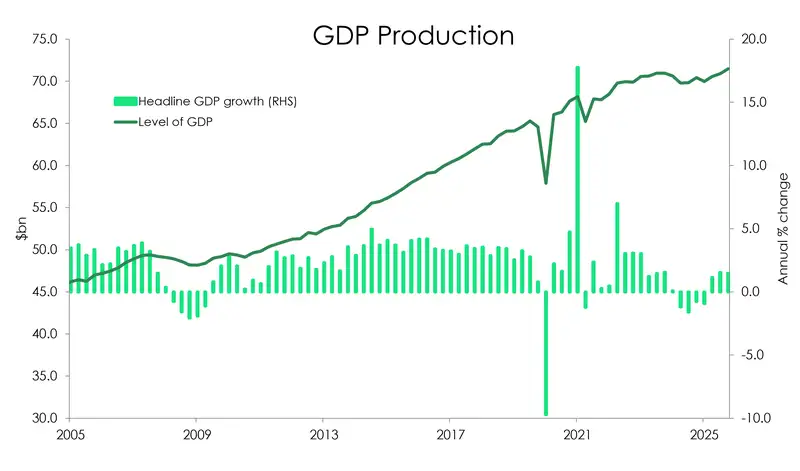
- The Kiwi economy grew a modest 0.8% in the March quarter of 2026. With a revision to the 2025 December quarter (up to 0.5% from 0.2%), placing it in a strong position. Economic activity lifted 1.5% over the year. The economy was strong coming into the oil crisis, but not burning up.
- Most industries saw an increase in output (9 out of 14). With the strength in today’s report coming from equipment and technology upgrades across the board. Strong investment in computing also helped drive up the expenditure side of GDP.
- The starting point of the economy coming into the oil crisis was solid, but not so strong to send inflation fears soaring. The RBNZ is all too aware of how dated the numbers are. The potential damage to demand from the increase in oil prices still outweighs the lift in inflation. With the war seeming to wrap up this week, the June and September quarters of this year will be much more important.

Today’s economic report card for the Kiwi economy came in a little over what was expected. Growth in the March quarter of 2026 was modest but showing signs of progress.
Output lifted 0.8% over the March quarter, just above our forecast of 0.7%. Meanwhile, the modest 0.2% lift in activity originally reported for the December quarter was revised up to 0.5% qoq. Compared to March of last year, GDP rose 1.5%. An up-side surprise relative to the consensus, but some of it explained away by revisions to previous data. From the Reserve Bank’s perspective, the economy was moving along nicely on its growth trajectory before the war in the Middle East, but not shooting for the moon. And that’s key. Modest growth does not stoke inflation fears, with the output gap closing slowly.
Around 75% of the up-ward revision to the Dec quarter was due to revisions to building activity estimates, which came in stronger that first estimated. The remainder was mostly due to revisions to agriculture estimates.
Up-ward drivers by industry
Nine of the 16 industry groups showed solid growth. One of the biggest industries to grow, was manufacturing, up 1.9%. This contributed 0.2% to the overall quarterly growth rate. Driving this, was transport equipment and machinery manufacturing. But wholesale trade, also driven by machinery and equipment wholesaling, was up 2.4%, contributing 0.1% to growth. Similarly, retail, trade and accommodation was not to be left out, although providing more modest growth of 1.2%.
Business services were also up 1.1%, largely driven by advertising, market research and management services, with computer system design also contributing. There may be some AI related activity beginning to show here. With computing services up, along with purchases of computing hardware.
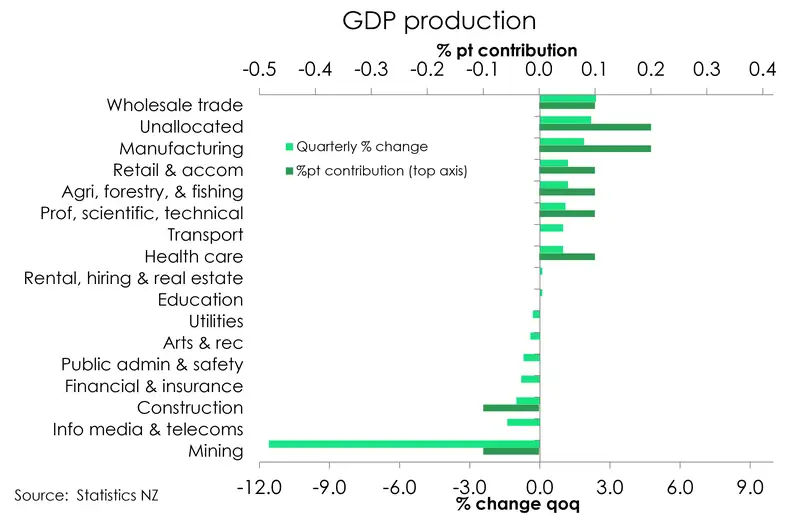
Down-ward drivers by industry
Construction proved to be the main drag on growth. Down 1% qoq, and driving 0.1% of the overall GDP down with it. No surprises there, given the rhetoric we’ve been hearing from the construction industry coming into this year. Mining was also a drag, down 11.6% compared to last quarter. Mining makes up such a small proportion of our economy, this dramatic-looking shift only contributed 0.1% drag on overall growth.
Expenditure boosted by technology investment
On the expenditure side, we saw a 1% lift in activity, compared to the December quarter of last year.
We had a large up-tick in plant machinery and equipment (5.5% qoq), largely driven by computers, including imports. We may have the AI revolution to thank for some of this growth in expenditure. Expenditure on transport and equipment lifted 6.7% qoq, a huge jump from the -11.4% we saw in December. Business investment also saw an up-tick of 3.7%.
Final household consumption expenditure was up 0.5% on the December quarter. Expenditure on non-durable goods was up 0.3%, durable goods was up 0.6% and services up 0.4%. A marked change from the decreases we saw in the December quarter.
Building and construction is still a drag here, as it was on the production side. Expenditure on residential buildings was down 3.1%, while non-residential building was down even more, 3.4% compared to December. With the stale housing market still struggling to breathe life back into the sector, this was no surprise to see it reflected in the numbers.
What does that mean for us going into the oil crisis?
Overall, we've managed to produce just 0.8% of growth over the year ending March 2026, and just 0.5% on a per head (capita) basis. We're not exactly flying to the moon any time soon. And that’s before the sharp deterioration in the outlook given the conflict in the Middle East.
Today’s data is old. It covers the 3 months of the year that were largely unaffected by the international turmoil that broke out at the end of February. Now the outlook for the economy is shifting by the day. With the war in the Middle East nearing an end, much of the impact is yet to be measured. Higher petrol prices deepened the cost-of-living-crisis during the June quarter. We know increases in the price of essentials, like petrol, act like a tax on household consumption. Surging prices squeeze disposable incomes and pull spending away from elsewhere. Household consumption will be down, even if expenditure is not.
So it's more about the starting point (strong-to-modest) and momentum into the oil crisis. This is not an economy demanding RBNZ rate hikes to fight off a supply-side shock. The potential damage to demand outweighs the lift in inflation. We have some hope that the economy will sputter for a short time, until the end of the year. Tracking sideways, but not tanking. Which was our biggest fear coming into this.
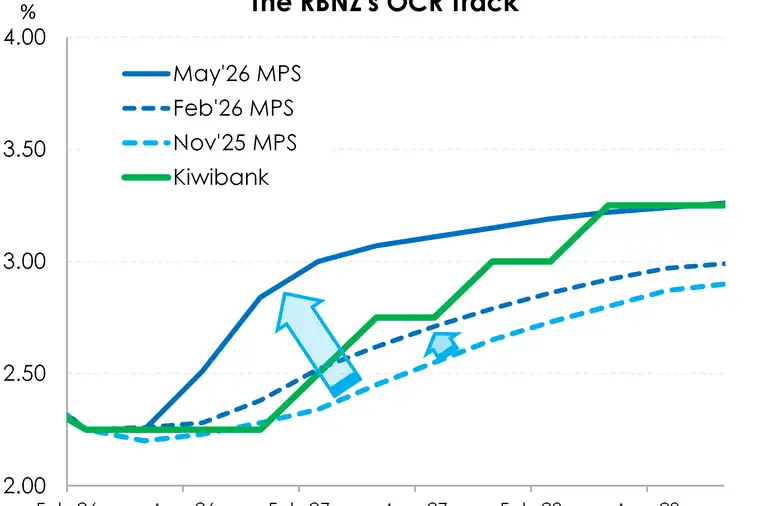
We expect that if the economy isn’t weighed down by unnecessary rate hikes, we can get back to a recovery in 2027. But rate hikes are still part of the story as far as the RBNZ’s scenarios are concerned from their May MPS. So the war being over does not necessarily move the needle on our call yet, that a rate hike is more likely than not in July.
All content is general commentary, research and information only and isn’t financial or investment advice. This information doesn’t take into account your objectives, financial situation or needs, and its contents shouldn’t be relied on or used as a basis for entering into any products described in it. The views expressed are those of the authors and are based on information reasonably believed but not warranted to be or remain correct. Any views or information, while given in good faith, aren’t necessarily the views of Kiwibank Limited and are given with an express disclaimer of responsibility. Except where contrary to law, Kiwibank and its related entities aren’t liable for the information and no right of action shall arise or can be taken against any of the authors, Kiwibank Limited or its employees either directly or indirectly as a result of any views expressed from this information.