
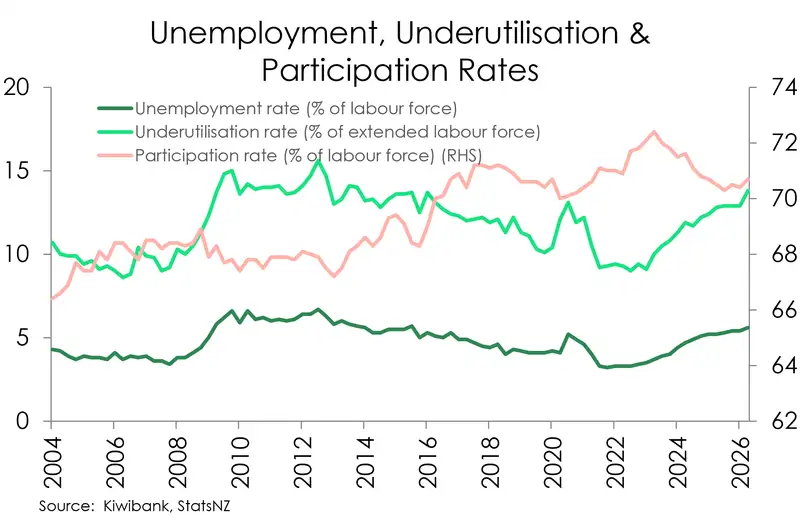
- The unemployment rate hit a painful 5.6% in the June quarter. The underutilisation rate grew to 13.8%, the highest in over 12 years. But some good news is that the labour force grew over the quarter. The participation rate was up to 70.7%. Employment tracked sideways, staying at 66.7%.
- There’s more slack in the labour market now than at the start of the year. Largely driven by low business confidence, uncertainty, and lacklustre consumer demand. Wages therefore are going backwards in real terms, growing only 2% compared to prices which are up 4.1%.
- Operating costs are going up while demand is weak. But the economy is split into two halves: the South Island and the North Island. With unemployment 3.7% in the South and 6% in the North.
Ouch! The unemployment rate climbed to 5.6% in the June quarter. We were expecting the Kiwi unemployment rate to peak at 5.6% later in the year, but it came earlier than expected. This down-side surprise hurts. The March quarter unemployment rate was also revised up, to 5.4% from the previous estimate of 5.3%.
While the unemployment rate rising is worrying, we are more concerned with the underutilisation rate. This increased to 13.8%, from 12.9% in March. The highest it’s been in over 12 years (since December 2013). The rate is higher for women than for men.
The news is mixed however. The labour force grew by 0.7% over the quarter. If the size of the labour force hadn’t changed the unemployment rate would still be 5.6%. That’s worrying. But the participation rate increased to 70.7% from 70.4%. Another silver lining is the employment rate remaining steady, at 66.7%. With a quarterly growth rate of 0.5%, the number of employed Kiwi grew in proportion to the size of the labour force.
Input costs for businesses have increased considerably (due to sky-high oil prices) over the first half of this year. The Reserve Bank has commenced an interest rate hiking cycle that will increase the cost of borrowing and slow down the economy. The true effects of the economic downturn due to the Middle East conflict may not have fully materialised in the data yet. With considerable slack left in the labour market, the Kiwi economy is not in for an easy recovery.
On the earnings front, the picture is fairly bleak. After two consecutive quarters of inflation running above the Reserve Bank's target band of 1-3%, households have felt the bite of the cost-of-living crisis strengthen. Wage growth is unchanged from the March quarter, unlike inflation which rose sharply. Prices rose twice as fast (4.1% annually) in the June quarter, compared with wages (up 2%). Wages are up slightly more in the private sector (2% annually) compared with the public sector (1.7%).
Public sector earnings still sit well above the private sector on average. Average total weekly earnings in the private sector increased to $1,642. A 1% jump over the March quarter. The average public servant experienced an insignificant 0.1% jump to $2,062. The average total weekly earnings across all workers is $1,730 per week. Considering inflation was up 1.5% over the quarter, neither group is better off in real terms. And that's likely to remain the case for some time. With unemployment at its highest since September 2015, workers have relatively low bargaining power to negotiate higher wages. This takes domestic demand off the list of things the Reserve Bank needs to worry about…
This is different to COVID. The pandemic period saw the cost-of-living rapidly increase. But a tight labour market (lower unemployment) gave employees more bargaining power. Wages rose much faster compared to today as a result.
The lacklustre wage increases Kiwi workers are currently experiencing puts households further and further behind inflation.
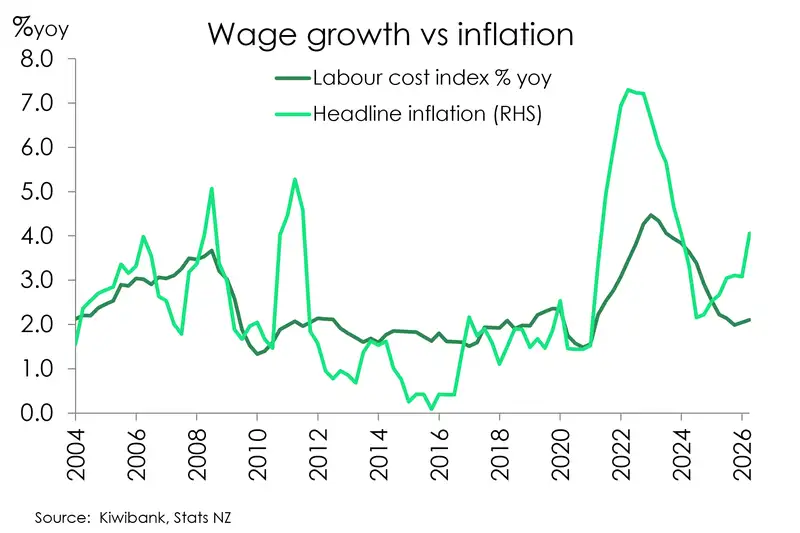
The divergence of the inflation (CPI) and labour costs (LCI) indices is the proof in the pudding. Wages have simply not caught up with prices.
The spare capacity in the labour market plays an important role in our economy. The labour market tightens when demand for goods and services is high, and loosens when it isn’t. Right now, demand is lower than we’d like. Kiwi businesses are not expanding. Not hiring. Because businesses don’t expect households to jump in and demand more stuff right now. The labour market reflects this softness. Costs have gone up for businesses and households, most increases coming in from overseas. In response, people buy fewer items because budgets have largely stayed the same. That’s the definition of households going backwards, and the cost-of-living crisis biting down hard and not letting go.
Because Kiwi households can’t afford to buy more stuff, Kiwi businesses can’t afford to expand and invest. That means fewer new jobs created and less pressure on business owners to offer big pay bumps to keep staff around or attract new talent.
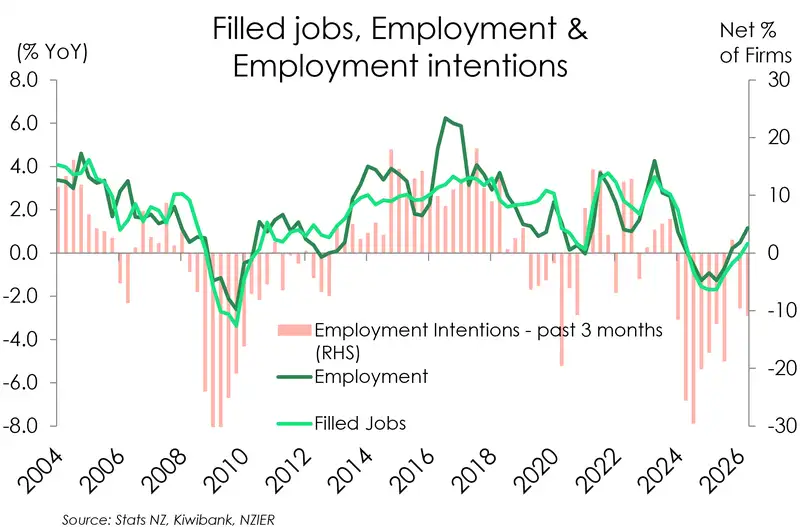
Employment intentions have been in negative territory for a long time. Other than a slight peek over zero in December of 2025, they’ve been negative since March of 2024. Filled jobs grew by an estimated 0.4% over the year. While we’ve had consistent positive net migration since the third quarter of 2022. The population is growing faster than new jobs.
Young people are especially affected… On the bright side, the proportion of youth (15 – 24) not in employment, education or training has fallen to 13.8% from 14.4% (seasonally adjusted). That’s good news. We need that. But that movement is largely due to movement into education. Exactly what we’d expect when young people can’t find a job with their current qualification levels. They look to up-skill. The proportion of the youth (15 to 24) unemployed but in education has increased by over 10% since March. The proportion of youth employed and also in education has increased by almost a third (32%). That’s 35.5 thousand more young Kiwi working while studying. Over half, 18.4 thousand are aged between 15 and 19 years old.
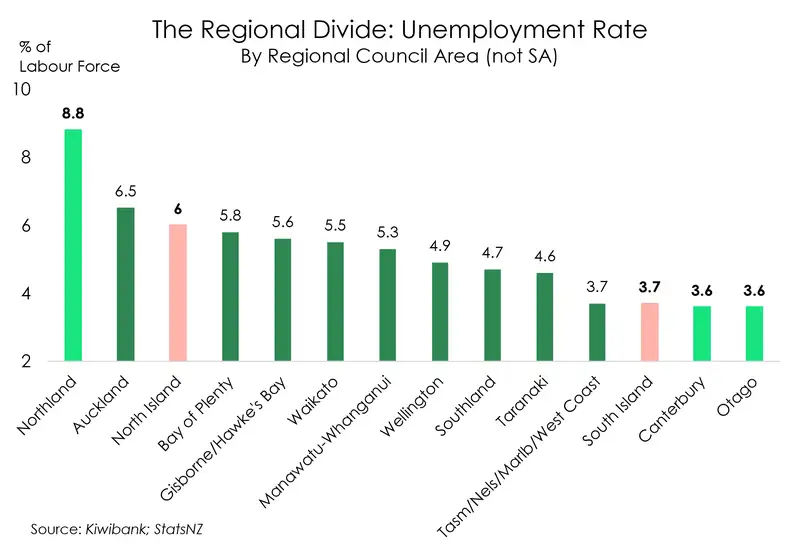
Another divide was prominent in the data, this time by region. The South Island unemployment rate is much lower than the North. At 3.7% for the June quarter compared to 6.0% in the North. The regional divide has been growing larger since 2021. The South Island has strong demand for manufacturing from overseas markets. Higher house price growth. AND, lower unemployment…
We note that the unemployment rate is highest in Northland at 8.8%. Followed by Auckland, which perhaps surprisingly, beats out Wellington. With the Auckland unemployment rate at 6.5% compared to capital’s 4.9%. The lowest unemployment rate can be found in the Canterbury and Otago regions, both at 3.6%. The North and South have very different economic outlooks. For the South, we’re calling it a forecast. For the North we’re calling it a weather warning.
All content is general commentary, research and information only and isn’t financial or investment advice. This information doesn’t take into account your objectives, financial situation or needs, and its contents shouldn’t be relied on or used as a basis for entering into any products described in it. The views expressed are those of the authors and are based on information reasonably believed but not warranted to be or remain correct. Any views or information, while given in good faith, aren’t necessarily the views of Kiwibank Limited and are given with an express disclaimer of responsibility. Except where contrary to law, Kiwibank and its related entities aren’t liable for the information and no right of action shall arise or can be taken against any of the authors, Kiwibank Limited or its employees either directly or indirectly as a result of any views expressed from this information.