
- A stalemate in the Middle East conflict is still causing waves. The uncertainty and elevated oil prices are weighing heavy on most economies (and NZ is no exception). Uncertainty kills growth, as businesses and households face high fuel prices with no end in sight.
- The end of last week saw some drama in US markets, with the S&P500 taking a strong dip, falling 2% in a single day. The shake up after a stronger-than-expected job markets report, forced investors to rethink Fed hike rates. Expectations of rate cuts have turned quickly into rate hikes. The yield on the 2-year Treasury bond has lifted from a low of 3.4% earlier in the year to 4.15%. The 10-year Treasury yield popped back above 4.5%.
- The Kiwi economy is still struggling, and we now face rate hikes from our own reserve bank. The construction sector has been one of the hardest hit, and the data shows it. Despite improvements in the number of building consents issued, the value of building work put in place has taken a nose-dive across the country.
The war in the Middle East may be at a stand-still (as is the Strait of Hormuz), but that’s not the case for markets. Volatility shook the US market on Friday, after a better-than-expected job markets report. Despite an unchanged unemployment rate of 4.3%, Nonfarm payrolls rose 172k. This prompted investors to increase their bets on future Fed rate hikes. Fears of higher interest rates prompted the moves in markets. Higher interest rates lift discount rates and eat into corporate profitability. The S&P 500 doesn’t like this.
Following Friday’s selloff, the U.S. 10-year Treasury yield settled around 4.53%, while the 2-year note settled near 4.16%. The spike in bond yields led the S&P 500 to dip by 2% into market close. NZX50 also fell 0.6%. So much of the recent gain is pinned on AI related company success, with very aggressive expansion plans and promised returns.
The VIX index, a measure of market panic, spiked up 39%. The market reaction was strong, and swift. The price of oil lifted last week, to 97USD, but has since dropped to 93USD. The price is still elevated, but is not showing signs of stress, which previously saw a price of $118. We are still well south of the downside risk scenarios where crude could hit +$130.
In contradictory news, housing consents rose, while building work fell. In April, consents were up a solid 16% over the year. And it was good to see more than half of the consents were higher density (arguably more affordable) homes. Auckland saw 21% growth behind Canterbury at 29%, and even Wellington recorded a gain of 13%. But good news is slim pickings for construction. Construction activity is still uneven, to put it politely. The spike in diesel added to elevated costs of building supplies (up 15%), and is causing many developers to postpone or cancel projects. The value of building work put in place has taken a sharp downturn across the motu. The data is simply weaker than expected. And the data is simply adding downside risk to growth estimates.
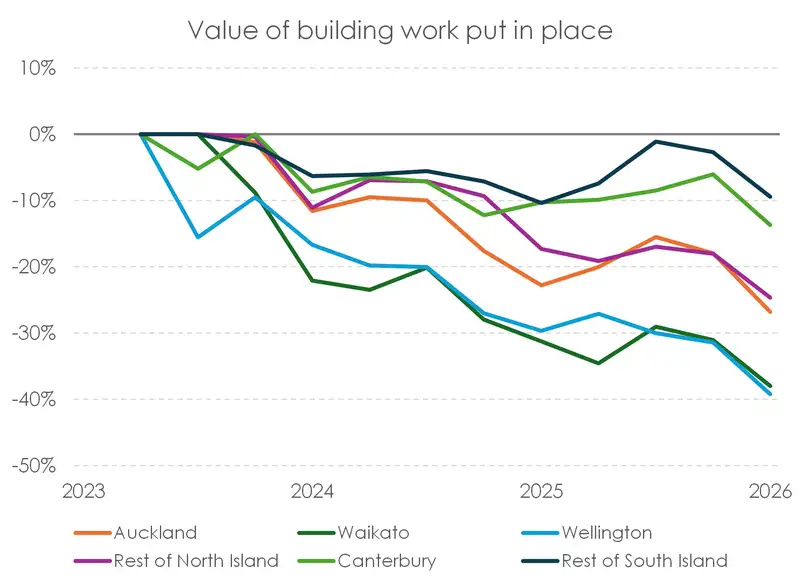
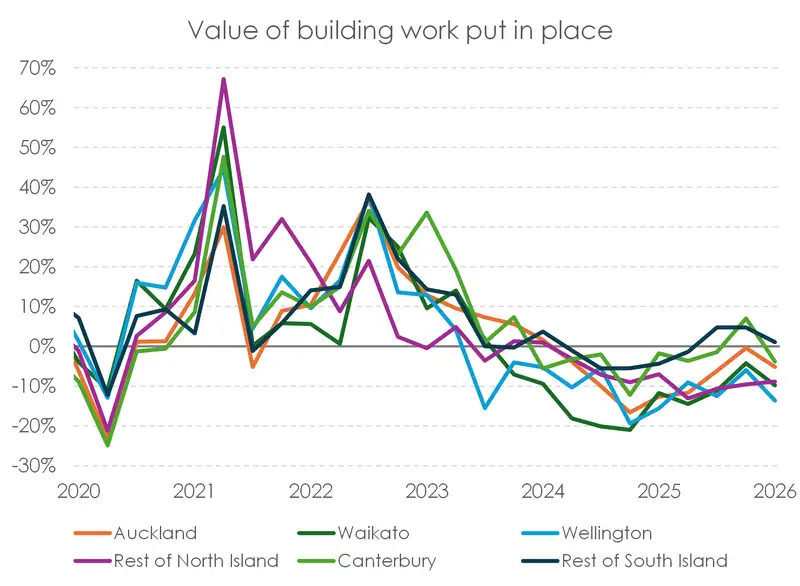
Our cover chart shows the declines across the regions, peak to trough, in building work put in place. Over the quarter, Canterbury has taken the sharpest fall. It’s a surprise, given the standout performance of the region. Maybe we’re at a turning point, but the garden city (Chch in green) is still a top performer. Canterbury feels like another country, compared to the North Island. From peak to trough, Canterbury is down 14%, second only to other regions south of the border. In the North Island, things are a lot worse. Wellington is the weakest, down 39%, Waikato is down 38%, and Auckland is down 27%. These are miserable numbers, and show three years of contraction. Our second charts shows the Covid induced surged, which kick started the boom to bust. And yes, the RBNZ engineered the recession to rein this in. Our argument remains, they need to allow the industry to recover.
As for the RBNZ, we’re likely to see a rate hike at the next meeting. The move is likely to come despite the destruction in demand, most evident in construction activity. The market is reasonably convinced with 22bps (90% chance) priced in for July, and 74bps (99% chance of 3 hikes) priced by the end of the year. The RBNZ has indicated quite strongly (with three out of four MPS scenarios) that they are likely to go to 3% by December.
Financial Markets
The comments below were provided by Kiwibank traders. Trader comments may not reflect the view of the research team.
Rates – RBA warnings on inflation
A shortened week after the long weekend saw the market continue to digest the prior week’s MPS and the various comments from MPC members alongside some interesting dataflow from both here and Australia. Tuesday’s local open saw our rates market open firmer despite higher rates seen in international markets over the break. Comments from an MPC member late the prior week around their preferred timing and extent of the path did provide a degree of underpinning, with the curve finishing flat to small down at the front and higher at the back, pivoting around the 3-year area. Over the week this small down and steepening theme was prevalent, with the implied path making some small incremental adjustments, with year-end priced probability cycling lower back towards 3.00% where some thoughts are that this may track within a high 2.90%’s to 3.10% band depending on data or comment at any time. With the RBNZ cash path having aligned largely with market pricing headed into the MPS, the relative certainty did draw out receiving interest for the shorter terms, with some interest also in the forward-start space that may be worth watching for indications of perhaps where thoughts on ‘short-term neutral’ may be. Data flow did see some mixed indications, building approvals posting a considerable gain on the prior month, though data on the value of building work put in place showed a decline of 5.9% in Q1 against Q1 2025, while the RBNZ’s own GDP now predictor model recorded a small tick higher for Q2, lifting to a 0.05% estimate for the quarter from 0.01% for the prior week.
RBA speak and data over the week also was of interest, commentary from RBA officials generally continued to sound warnings on inflation while their implied curve continued to trade only one further tightening as a high-probability. Comments from a Monetary Policy Board member, on an uptick in inflation expectations and that strong policy action would likely be needed if these expectations were to become unanchored, were noted. This was around the same as the Fair Work Commission announced an increase in the minimum wage of 4.75%. With this considered perhaps a sign of potential second-round inflation effects starting to permeate into the economy. Governor Bullock again reiterated the inflation story, noting that persistent inflation would mean higher rates for longer, though indicated that there were signs that policy tightening to-date was starting to work. MPB commentary continued after our close on the week, with Deputy Governor Hauser speaking on the economic outlook. Data-wise, releases tended to be on the weaker side, including Q1 GDP at +0.3% for the quarter against expectation of +0.4%. As we have previously noted, the turn in dataflow from Australia and potential rate path divergence may now indicate a little more two-way risk in the direction of the NZDAUD cross.
Over the week our curve was seen generally lower but steeper, 2-year IRS at 3.475% (-4-points w/w) and 10-year 4.21% (+1 w/w), while the implied cash path continued to track closely with the RBNZ average cash rate path in the recent MPS with July still trading near-certain for a 25-point increase and the year-end expectation just dipping below three 25-point tightenings at 2.99% implied for the December meeting. The market continues to price the H1 2027 path above that modelled by the RBNZ, at around +11 and +27 for Q1 and Q2, so perhaps may offer some support to the front of the curve should the data flow not diverge greatly from expectation seeing this pricing align more closely. Of course, there will always be the event risk disclaimer around geopolitical risks and data. In this instance, significant US data due, namely payrolls, may play its own card as generally US data of late has been on the firmer side, Fed-speak on the firmer side, and a rate path that has sided generally that the next move is higher starting late 2026. Here a firm print may prompt the risk of a rate market self-fuelling selloff where a product of the duration extension on mortgage books is a rate market selloff as investors look to maintain the duration of their portfolios. Graham Hughes, Trader – Financial Markets.
In currencies - Indestructible US jobs sector & destruction in the middle east brings US Dollar exceptionalism:
A tough end to the week across financial markets, driven by heightened expectations of further Fed tightening into year-end. This followed an “on the surface” strong May US employment print and a re-escalation of tensions in the Middle East, which saw the Kiwi come under a renewed bout of pressure. NZD/USD closed the week below 0.58 and through the 61.8% Fibonacci retracement at 0.5801, likely setting up a fresh period of underperformance—at least through the early part of the week ahead. Following its stellar late-May rally into 0.5994, the Kiwi finished last week at the bottom of the G10 performance table versus the USD, declining 2.31% over the first week of June. That said, despite the negative price action, NZD/USD remains comfortably within its Q2 range, with support lining up at 0.5750, followed by the highly critical 0.5680 level.
Friday’s US payrolls release appeared flattered by strength in the hospitality sector—contributing around 70k of the 172k jobs added in May—likely linked to seasonal demand ahead of the FIFA World Cup. Elsewhere, the report painted a picture of stability rather than inflationary pressure, with wage growth broadly in line with expectations. The market has nonetheless leaned into the inflation narrative, with Fed funds futures now pricing around 43bps of tightening through to mid-2027. Time will tell on the ultimate path, but for now the pendulum has clearly swung back in favour of the hawks.
Looking ahead, focus turns to US CPI for May, while markets will also be watching the Bank of Canada and ECB rate decisions closely. Expectations remain for the ECB to kick off its hiking cycle with a 25bp move at its meeting. Hamish Wilkinson – Senior Dealer, Financial Markets.
The Week's Key Events:
- Not a lot of domestic data is expected this week. Business financial data including Manufacturing sales q/q is due out on Tuesday. Travel and migration data for April is expected Friday.
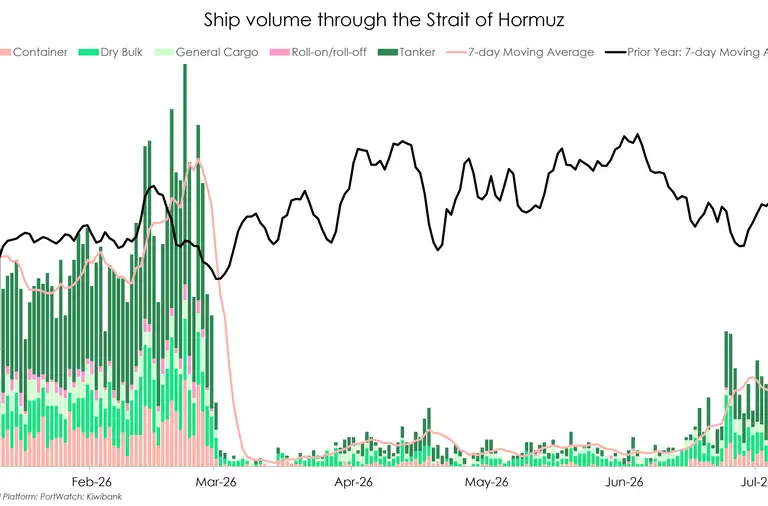
- We repeat from last week (feels like we're in purgatory): The war in the Middle East drags on. The tenuous negotiations making headway last week appear to have stalled. We aren’t expecting a swift resolution, but we still hold on to hope regardless.
- Internationally, we have Aussie consumer sentiment data out on Tuesday alongside business confidence numbers. US has core CPI data out on Thursday, with markets anticipating rate hikes from the Fed, this print might create more swings. China also has CPI data out this week, as well as PPI (both out Wednesday).
All content is general commentary, research and information only and isn’t financial or investment advice. This information doesn’t take into account your objectives, financial situation or needs, and its contents shouldn’t be relied on or used as a basis for entering into any products described in it. The views expressed are those of the authors and are based on information reasonably believed but not warranted to be or remain correct. Any views or information, while given in good faith, aren’t necessarily the views of Kiwibank Limited and are given with an express disclaimer of responsibility. Except where contrary to law, Kiwibank and its related entities aren’t liable for the information and no right of action shall arise or can be taken against any of the authors, Kiwibank Limited or its employees either directly or indirectly as a result of any views expressed from this information.