
- Consumers had a better month in July, with strong card spending data and generally mild price changes. Apart from air travel. The cost of jet fuel is largely to blame for that. But population growth is low. As in, 1940s low…
- Businesses have lower expectations of future inflation compared to last quarter. 1-year ahead expectations fell from 3.68%, narrowly sneaking within the Reserve Bank’s 1-3% band at 2.99%. However, business price index data shows further evidence of margin squeeze.
- Aussie labour market, inflation expectations and PMI data suggest the economy is an engine that is steadily ticking over, but not at risk of overheating.
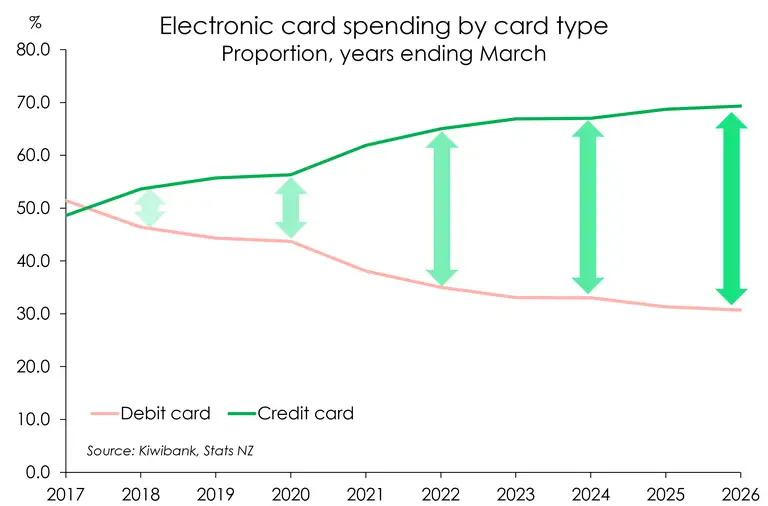
Consumer spending rebounded strongly after a weak June, suggesting household demand is improving. Increased spending was evident in hospitality, durables, apparel and consumables. Spending on fuel fell by 4.3%, reflecting lower retail fuel prices in July compared with June. We calculated a 5.9% reduction in average monthly 91 petrol prices between June and July using MBIE fuel data. The fall in card spending on fuel likely reflects price decreases rather than lower volumes.

Select price indexes for July showed that, generally, prices were relatively stable over July. The biggest moves were 21% in domestic and 11% in international airfares. However, the price of Jet A1 (jet fuel) was up by approximately 11% on a monthly average basis. Fuel represents a relatively higher proportion of the total costs to operate short haul domestic flights than long haul flights. This may partially explain the more acute lift in for domestic flight prices.
New Zealand’s resident population reached an estimated 5.357 million at the end of June. Population growth over the year was 36,400, a 0.7% increase with a nearly equal split between natural increase and net migration. The natural increase was the lowest since the early 1940s. It’s not often we get to say a figure hasn’t been this low in over 80 years. It doesn't feel great.
Business price indexes for the June quarter show input costs rising faster than output prices (2.9% vs 1.6% quarterly). Further evidence of business’s margins being squeezed, and relatively low rates of pass-through. Electricity, gas and transport were big contributors to both input and output prices, closely mirroring pressures faced by consumers.
New Zealand’s trade deficit in July was $1.9bn. June’s narrow trade surplus of $23m was revised down to a $237m deficit. And no, that wasn’t a typo. The ballooning trade deficit was caused by imports rising by more than exports, at 14% and 28% respectively. Of the $2.1bn increase in imports in July, almost half was in petroleum alone. That’s a 127% increase in petroleum import values compared with June, reflecting much higher oil prices in July. That means 44% of July’s increase in import values was attributable to fuel. A stark contrast to fuel prices at the pump in July, and a sign that the respite at the pump will likely end soon.
Fertiliser, another fossil-fuel based commodity also contributed heavily to the increase in import values. On the exports side, dairy and meat continue to support New Zealand’s export sector.
The Reserve Bank released the findings of its Business Expectations Survey for the third quarter of the year. Businesses reported lower inflation expectations across the board, consistent with the Reserve Bank’s recently released Survey of Expectations fielded to professional forecasters. Businesses’ 1-year ahead inflation expectations fell from 3.68% to 2.99%. Comically close to the Reserve Bank’s 3% upper limit of its target band. Still, they will be happy with the direction inflation expectations are going.
BNZ BusinessNZ’s July Performance of Services Index (PSI) revealed that the services sector expanded at a slower rate than June. Considering it is the second consecutive month of expansion, the services sector appears to have moved back into growth, albeit with a shallow and uneven recovery. Labour demand in the services industry remains very subdued, and the recovery is entirely propped up by activity in the south of the South Island. All other parts of the country were in contraction - further evidence of a north-south divide.
The global dairy auction saw the Global Dairy Trade (GDT) index increase by 2.3% to US$3,873 (NZ$6,597). This was a bullish (if you’ll excuse the pun) auction, reflecting concerns around future milk supply in light of El Niño and northern hemisphere heat.
Across the Tasman
Aussie unemployment rose slightly to 4.5% from 4.4%. The number of unemployed Australians rose 45.1k over the year, a 7% increase. Employment fell by 15.8k vs a prior 76.3k gain. The market expected a 12k rise. The fall in employment was driven by part-time jobs. Full time employment grew by 16.3k while part-time employment fell by 32.2k.
Aussie Performance of Manufacturing Index (PMI) printed relatively soft. Although all measures, except for manufacturing, remain in the expansion levels above 50.
All of this points to an Aussie economy that is slowly ticking over, but has had some of the wind taken out of its sails due to elevated interest rates. It’s certainly not looking like an economy that is at risk of overheating.
Financial Markets
The comments below were provided by Kiwibank traders. Trader comments may not reflect the view of the research team.
Rates – International drivers
Last week, in addition to the local SPI data, international markets provided additional input to direction for rates, with Fed minutes, a US Treasury announcement, and the usual collection of Fed-speak coupled with more commentary from the RBA and of course the ever-popular monthly Australian employment read. The Mid-East conflict continued with a further hardening of positions, though the market seems not to be as reactive to these headlines as they once were. For the week, our curve finished higher, with 2-year IRS closing at 3.67% (+5bp week-on-week), 5-year at 4.04% (+7bp), and 10-year at 4.45% (+7bp), while the implied curve again found itself trading above 3% at 3.03% (+4bp) for the year-end OCR.
Locally, the start of the week saw the SPI or Selected Price Indices released on Monday. This series includes the FPI along with other selected categories that together comprise around 45% of the CPI basket by weight. The release saw a 0.1% increase in food prices on the month or around +1.9% on the year which comprise around 18.5% of the overall basket, while household utilities saw some negative prints though still saw strong price increases for the likes of power and gas over the year. Amongst the transport group, petrol and diesel declined though air travel increased. Overall, this saw some softening expectations around Q3 CPI forecasts by some, though the market response was muted. The usual late Friday releases on the RBNZ GDPnow model seeing only minor movements on the predictor model week on week and the business expectations survey (the M15) showing declining inflation expectations didn’t move the dial greatly on rates.
Internationally there were several drivers. US markets created interest on the mid-week with the release of the minutes of the last Fed meeting and an unexpected announcement by the Treasury that it would double the maximum size of its liquidity support buyback operations for longer-dated coupon issues, targeting the 10- to 30-year sector, from September through to November. The headlines from Fed minutes retained a hawkish bias noting of course the 9-3 decision to hold on the day, reporting that officials generally viewed upside risks to inflation with some noting that conditions may not be restrictive enough, though it was acknowledged that financial conditions had tightened over the intermeeting period. Though as our economics team noted, the reported headlines may have read a little stronger that the actual minutes. This leads us to again note that you need to account for the voter rotation on the FOMC when reading or listening to their remarks, as the committee membership changes at the first regularly scheduled meeting of the year. The Treasury announcement was unexpected and resulted in a flattening of the curve, this after longer dates had reached multi-decade highs in the days prior to the announcement. While framed as providing further liquidity support to an existing operation, the general interpretation was that this was aimed at attempting to cap the rise in long-term yields. Similar type actions have been seen before over the years. Overall, their curve saw 30-year and 10-year lower by around 10bp and 6bp respectively, while 2-year was -1bp on the day. Our curve looked to mimic the move on the day, flattening, though pivoting around the 5-year part of the curve with 2-year higher by 2bp, and 10-year lower by 3bp, though these moves in markets were short-lived, largely reversing the following day.
In Australia, we had comments from RBA Deputy Governor Hauser, where the usual RBA themes were reiterated, that inflation was too high, some concerns over upside risks to this remained, and that productivity was a challenge. The regular reminders around the inflationary concerns within the Australian economy and the potential for second-round effects, and remarks on disappointing productivity have seen the Australian short-curve continue to price in near-one more tightening in the implied path, with the priced cash rate peaking around 4.55% or circa 80% priced of one more move. Australian employment data also proved to be another typically exciting print, with a headline employment change decline printing -16k jobs against +12k expected, and a lift in the unemployment rate to 4.5%. The fine print saw that the change in employment attributable to part-time losses while full-time jobs increased by 16k, and the headline lift in the unemployment rate from 4.4% was a function of rounding at the second decimal place. In typical fashion the AUD saw immediate selling on the headline followed by a strong bounce as the market found the detail, while the NZD maintained an interested observer role initially, avoiding the sell, before jumping on board the bounce.
Looking ahead, for our markets attention starts to shift towards the upcoming RBNZ MPS, and while the September meeting is priced at a near certainty of a 25-point hike, this will not detract from the interest on the day, particularly as this can often see the statement and or forecasts deliver up a surprise. Again, as we have noted previously on statements, we need to think on the basis of what we think they will do, not necessarily what we think they should do, incorporating considerations around the purpose of the RBNZ Act and the operational objectives of the remit. Local dataflow would likely support the measured approach to tightening that we have talked to before with current pricing a reasonable case – 3.00% cash year-end, and near 3.5% out one-year. Recent data flow may provide for an element of statement risk however, with survey data on inflation expectations that while elevated is at least headed in the right direction, the shape of the curve through the implied pricing path, and the and the recent lift in the level currency adding a degree of tightening, potentially areas that could open up some statement or projection risk, even if that is not necessarily intended. Previously we have noted that positioning at the front of the curve or those that exhibit a degree of roll down may see interest, and with global moves potentially applying a degree of steepening pressure this may also add an element to consider. As we often would note, trading sentiment remains vulnerable to rapid changes in the geopolitical environment and/or shifts in the data, so views will need to be reassessed as these unfold. Graham Hughes, Trader – Financial Markets.
In FX – Kiwi Catches a Tailwind
The NZD was one of the standout performers last week, driven by softer USD sentiment, NZDUSD saw gains of over 1.3% - coming in a close second to the Norwegian Krone in terms of G10 performance. What started as a conversation around rising US Treasury yields and a steeper US yield curve quickly became a story about Treasury Secretary Scott Bessent's surprise decision to expand long-dated Treasury buybacks, alongside hints of a broader fiscal consolidation package. While the buybacks initially pushed yields lower, the bigger impact was on the USD, as markets began questioning whether Treasury was simply providing liquidity to a bond market struggling under the weight of heavy issuance and growing fiscal concerns.
The irony is that only days earlier markets had been grappling with the opposite problem. Long-dated Treasury yields had surged to their highest levels since 2007 as investors appeared to demand a higher term premium in a world where the Fed has effectively abandoned forward guidance. Suspicion remains that the move was less about inflation and more about investors reassessing the true cost of lending money to the US government for 30 years. However, Bessent's announcement shifted the narrative from rising yields to fiscal credibility and, ultimately, the outlook for the USD itself.
For NZD/USD, the fallout was significant. The pair broke convincingly above the key 0.5915/20 multi-year resistance zone and accelerated to a 0.5988 high by Friday evening, effectively reaching a further significant 0.6093 – 0.5626 Fibo retracement 76.4% and May double top target zone. The move reinforces the view that a softer USD environment, driven by lower front-end rate expectations and growing questions around US fiscal sustainability, can continue to support the Kiwi over the medium term. While some consolidation around the 60-cent handle would not be surprising after such a rapid move, the breakthrough multi-year trend resistance leaves the 2026 high at 0.6093 as the next major upside target and increasingly in focus for the weeks ahead.
Closer to home, Australian employment data provided an additional tailwind. While the result itself softened expectations for further RBA tightening, ongoing re-convergence between Kiwi and Australian rate expectations remains supportive for NZD/AUD. With New Zealand front-end rates continuing to hold relatively firm while Australian tightening expectations gradually evaporate, the cross continues to attract buyers on dips and keeps the 0.8400 region, and above, firmly in its sights.
In short, last week's NZD strength was driven less by domestic developments and more by a changing global backdrop. The result was one of the strongest weeks for the Kiwi in some time, with the initial upside targets now achieved and the broader uptrend suggesting further gains towards 0.6093 remain a realistic prospect should USD headwinds persist.
The domestic calendar is relatively light this week, with Q2 Retail Sales the only notable New Zealand release. Across the Tasman, attention turns to the RBA Minutes and July CPI, both of which will be scrutinised for clues on how much further Australian rate expectations can be pared back after recent softer data. Offshore, Wednesday night brings a heavy US data slate, including GDP, Core PCE inflation, Durable Goods Orders and benchmark payroll revisions, before attention shifts to Fed Chair Kevin Warsh's Jackson Hole address on Friday. With Treasury markets still digesting Bessent's buyback announcement and ongoing concerns around US fiscal sustainability, investors will be looking for any insight into how Warsh views the recent rise in long-end yields and the Fed's role in guiding markets. Hamish Wilkinson – Senior Dealer, Financial Markets.
The Week's Key Events
- It’s a quieter week ahead in New Zealand compared to the rush of data last week. NZ Q2 retail sales will likely have been released by the time this publication goes live. New Zealand will also see labour market income statistics for the June quarter and employment indicators for July.
- Across the ditch, Australia will release its July inflation figures. Hotly anticipated given the meek labour market data we saw last week.
- In the US, a slew of data including the PCE index which the Fed uses as its primary gauge for rate decisions. The US will also release Q2 GDP and a range of housing data.
All content is general commentary, research and information only and isn’t financial or investment advice. This information doesn’t take into account your objectives, financial situation or needs, and its contents shouldn’t be relied on or used as a basis for entering into any products described in it. The views expressed are those of the authors and are based on information reasonably believed but not warranted to be or remain correct. Any views or information, while given in good faith, aren’t necessarily the views of Kiwibank Limited and are given with an express disclaimer of responsibility. Except where contrary to law, Kiwibank and its related entities aren’t liable for the information and no right of action shall arise or can be taken against any of the authors, Kiwibank Limited or its employees either directly or indirectly as a result of any views expressed from this information.