
- The latest employment data for the September quarter brought some surprising bad news. Unemployment increased to 5.7%. More worryingly still, long-term unemployment (those unemployed for longer than a year) is at the highest level since 1995, with more than 1 in 5 unemployed Kiwi spending more than a year out of work.
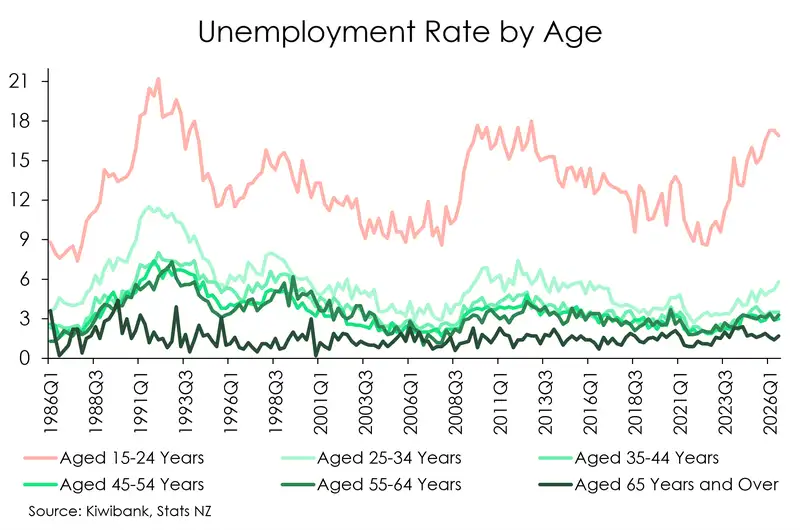
- Young people are even more disadvantaged, with the proportion of youth not in employment education or training growing. 14.1% of youth between 15 to 24 years old are doing nothing (productive) with their time, a trend we've seen persist since the June quarter.
- We can’t guarantee that this is the peak in unemployment. Offshore chaos is still driving prices for transport up across the motu, and many businesses have been facing higher costs, while consumers are pulling back on spending. This does not bode well for workers hoping for a decent pay bump.

The data for the September quarter shows that the Kiwi economy is hurting. The unemployment rate increased from 5.6% to 5.7%, defying both our optimistic expectations and the market’s. The underutilisation rate remained uncomfortably high, at 13.8% as many workers have shifted from full-time permanent roles to part-time and casual work. The number of actual hours worked dropped by 1.6% compared to the June quarter, and was down 0.5% compared to the September quarter of 2025. This is a symptom of business stress, as many Kiwi business owners look to cut costs, they first start by cutting hours. The number of employed workers fell by 0.1% compared to the June quarter, bringing the overall participation rate down from 70.7% to 70.4%.
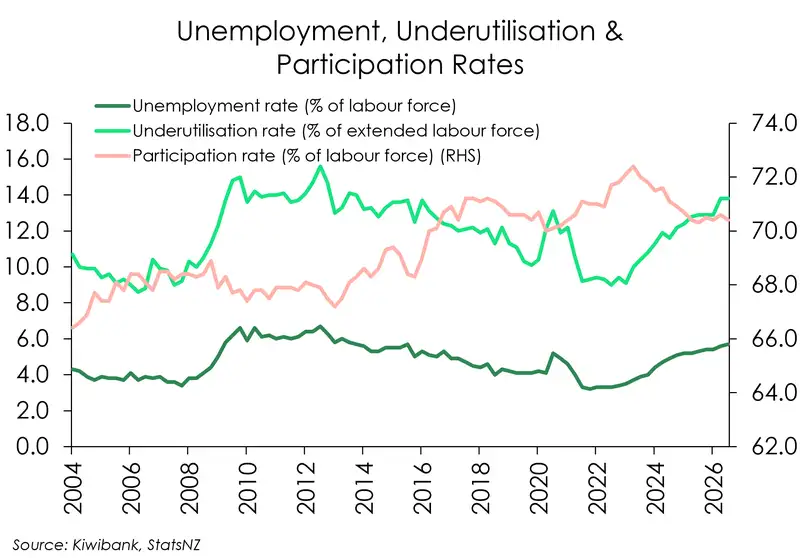
A lot of this movement can be explained by the sluggish growth in filled jobs. Filled jobs fell by 0.2% compared to the September quarter of 2025, and there was a 0.1% increase in filled jobs compared to the June quarter. This is not what we expected based on monthly filled jobs data. The shift in the size of the population also affected the headline rate. The working age population grew by 13,000 while the number of Kiwi not in the labour force grew by more, 14,000 on a non-seasonally adjusted level. The bad news did not stop there.
Kiwi spending longer than a year unemployed
The most worrying trend can be seen in the duration of unemployment, not just the size of the unemployed population. On a non-seasonally adjusted basis, Over 1 in 5 unemployed Kiwi (21.5%) report being unemployed for more than a year. This coincides with a marked decrease in the proportion of unemployed workers who have been unemployed for 3 to 6 months. The last time we had long-term unemployment rate higher than that, was in June 1995 (when it was 24.3%). Long term unemployment can cause workers to become discouraged and drop out of the labour force completely (i.e. stop looking for work), or move overseas. Long periods of time spent outside of the labour force also erodes workers’ experience and skills, making it even harder to find a job. After a year of unemployment, employers might start to question how up-to-date a candidate’s knowledge is, how long it would take them to get up to speed and if the cost of re-training the re-entrant is worth it.
Young people still struggling to find work
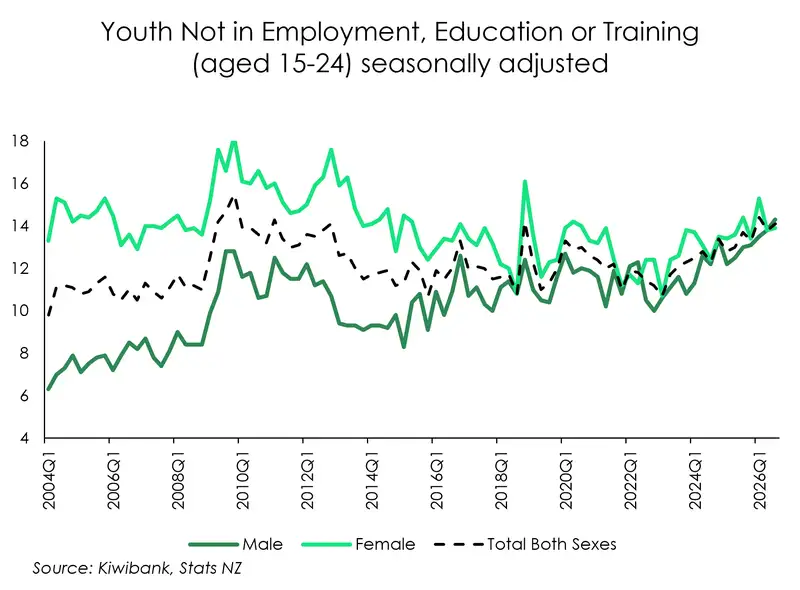
In addition, young people have been hit particularly hard. The September quarter continued the trend we’ve seen evolve over the last year. The proportion of those aged 15 – 24 not in employment education or training (NEET) has grown again, to 14.1%. The non-seasonally adjusted unemployment rate for those aged 15 – 19 has barely moved, from 25.3% in the June quarter to 25.2% in September. For those aged 20 – 24, the move was a little larger from 12% in the June quarter to 11.3% in September.
The regional divide is narrowing (but not closing)
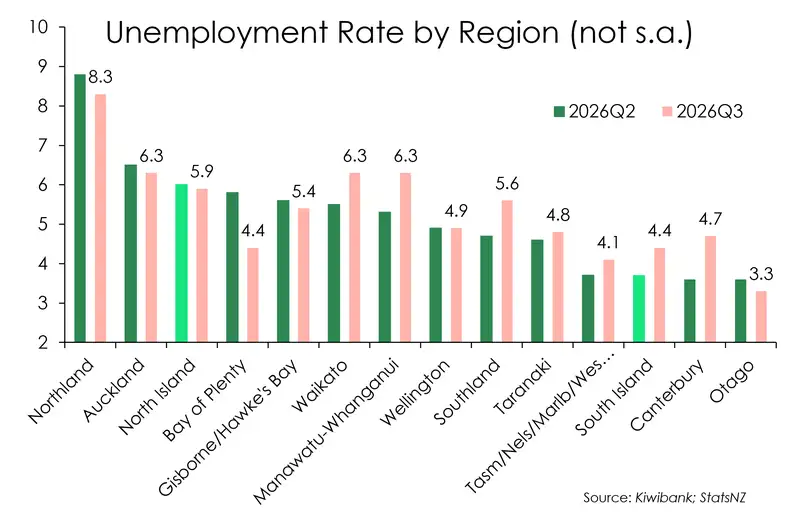
The regional divide is changing, with the North slowly closing the gap with the South. A dominant lead is turning into a marginal one as people move to where the jobs are, increasing the pool of workers available to draw from. Migration from North to South has been strong over the September quarter and we're seeing its effect on the unemployment rate. Canterbury's unemployment rate jumped a whopping 1.1% percentage points, from 3.6% in the June quarter to 4.7% in the September quarter. The North was not necessarily spared, although Northland's unemployment rate came down a touch from 8.8% to 8.3% and Auckland's rate also came down from 6.5% to 6.3%. But mighty Waikato saw a significant bump up, from 5.5% unemployment to 6.3% in the September quarter. Overall, the South still leads the labour market race, with the South Island unemployment rate sitting at 4.4% compared to the North Island sitting at 5.9%.
We expect the peak in unemployment is still ahead. The oil price has been uncomfortably high for the month of October, and that will feed into business costs and employment intentions as well as consumer confidence for the fourth quarter of the year. Recent progress in negotiations between the US and Iran have given us hope that domestic petrol prices will ease off. The future hinges on how well negotiations go. The labour market is, at least in part, at the whims of offshore developments. The economy has been bearing the strain of increased transport costs as well as input costs for many businesses. A soft labour market has limited the ability of workers to negotiate salary increases, while simultaneously putting downward pressure on prices businesses can charge. We need a substantial reduction in business costs in order for the labour market to have a chance of a true revival.
Wages not keeping up with inflation
The cost-of-living is front of mind. Many feel like their wages are not keeping up with the rising costs of everyday goods and services. And they’re correct. In the June quarter, we reported that inflation was running significantly above wages. It brings us no joy to report the same thing again in for the September quarter.
In the September 2026 quarter, prices in the economy went up by 3.7%. Wages on the other hand? 2.1%. The gap did close somewhat compared with June, where inflation was 4.1% and wages grew by 2%. But that's still a sizeable gap between people's wages and the prices they're facing.
The Reserve Bank of New Zealand may not have a dual mandate to consider when they set interest rates, but the labour market still plays a big role in their decisions. Their latest decision to hold the interest rate at 2.75% despite aggressive market pricing, and the expectation of a hike, feels justified. A weak labour market acts as a pressure lid on price growth. That’s the Phillips Curve in action. The oil shock price increases in the transport sector have had a limited effect on domestic price growth because ordinary Kiwi are not finding it easy to find work and bargain for higher wages, thus their ability to spend is constrained. Constrained domestic demand makes it tough for businesses whose costs have increased. To cut costs, they hours as well as jobs. So long as the cycle continues, increasing the interest rate is not necessary…
All content is general commentary, research and information only and isn’t financial or investment advice. This information doesn’t take into account your objectives, financial situation or needs, and its contents shouldn’t be relied on or used as a basis for entering into any products described in it. The views expressed are those of the authors and are based on information reasonably believed but not warranted to be or remain correct. Any views or information, while given in good faith, aren’t necessarily the views of Kiwibank Limited and are given with an express disclaimer of responsibility. Except where contrary to law, Kiwibank and its related entities aren’t liable for the information and no right of action shall arise or can be taken against any of the authors, Kiwibank Limited or its employees either directly or indirectly as a result of any views expressed from this information.