
- It’s Groundhog Day: “Ongoing instability in the Middle East has driven sharp swings in oil prices. These fluctuations continue to weigh on global sentiment and introduce volatility into the NZD”. It’s what we said in our last FX tactical and we’re saying it again.
- A weak NZD is supporting parts of the economy: While imports have become more expensive, exporters, manufacturers, farmers and growers, and tourism operators are benefiting from a lower exchange rate and strong commodity prices.
- The outlook remains volatile but resilient: The Middle East conflict, the November election, and Godzilla El Niño are key risks for the currency and economy. However, economic growth remains positive; businesses have adapted well to recent shocks, and we expect the RBNZ to maintain a gradual tightening path rather than the more aggressive rate increases currently priced by markets.
The fluctuations emanating from the war in the Middle East are making our Kiwi dollar spin on its head. There are several opposing forces working on our currency, but the oil crisis is heaviest of all.
Since March, we’ve seen a dollar that’s willing to hover in a tighter range than usual. The NZD/USD exchange rate has danced between a high of 0.60 in May and a low of 0.56 in June. And we aren’t here to complain about a bit of stability, but we are on edge. The trend since August has been downward. The RBNZ delivered two rate hikes… although the last was a “dovish hike”.
It’s often said that the Kiwi dollar derives much of its value from the interest rate differentials between New Zealand and the US. Higher interest rates attract capital. For years, the Kiwi dollar has benefited when investors earn a premium for parking cash here, rather than in the US. But the exchange rate is not driven by absolute levels. What matters is the relative outlook, which shows up in future (forward) dated interest rates. Markets are constantly weighing where rates are today against where they are expected to be tomorrow. Even as the RBNZ has tightened policy, US interest rates have remained elevated. The Federal Reserve has signalled it will keep monetary policy restrictive for longer. As a result, the interest rate advantage NZ once enjoyed has narrowed considerably. For investors looking for yield, a US dollar now offers returns that are much more competitive.
The US dollar has also benefited from its status as the world's reserve currency (once again defying those calling for alternatives). In periods of uncertainty, investors favour US assets, creating additional demand for the Greenback. This dynamic has blunted the impact of recent RBNZ hikes. While higher domestic rates would normally support the Kiwi, the market has been more focused on the resilience of the US economy. The wider gap between NZ and US rates, combined with sustained demand for US dollars, has left the Kiwi struggling to gain altitude.
Meanwhile, we have an NZD/AUD rate that fell from grace in April of last year, and remains down. That’s good news for our tourism sector, which feeds off Aussie tourists every summer. New Zealand remains on sale for the Aussies.
The Kiwi economy has benefited from low exchange rates with our main trading partners. Although the cost of imports (especially petrochemicals) has been painful, our exporters have been making the most of the Kiwi dollar weakness. Exporters have also had bumper commodity prices, a double whammy of good news.
We’ve seen this benefit parts (but not all) of the Kiwi economy. When we look at things geographically, the regional divide is prominent. As we pointed out in our recent Regional Note, the further South you go, the warmer the economy feels. It’s warm, but not hot. Agriculture is the biggest differentiator, with farms in the North doing well. But they are not the behemoths in the South.
Our manufacturing sector is also doing well. The Performance of Manufacturing Index (PMI) has been in positive territory for the third month in a row.
Tourism also makes a big difference, and it’s good. Really good. The latest tourism data showed:
“The total number of overseas visitor arrivals in July 2026 was a record for a July month and 100.4 percent of the 255,600 in July 2019.” Stats NZ
That’s right, we’ve finally returned to our pre-pandemic levels. And we are feeling even more optimistic about the summer season. Before the pandemic, tourism was our biggest export, and there’s no doubt that the tourist dollar (Aussie, US and Yuan) will make its way around the regions.
We’ve been waiting to see how our economy handles the oil shock. For the most part, we’ve been pleasantly surprised. Kiwi businesses did pull back at the outset of the crisis. Intentions to invest and to hire, dropped off a cliff. But most Kiwi have become veterans at surviving economic shocks. Over the last six years, we’ve had the Covid pandemic, the war in the Ukraine, the US tariff debacle and now this… and Kiwi business owners have adapted to every challenge. That’s not to say that our economy is all roses, but an undercurrent of growth is still with us. The June quarter growth rate of 0.2% gives us hope, as it wasn’t a contraction.
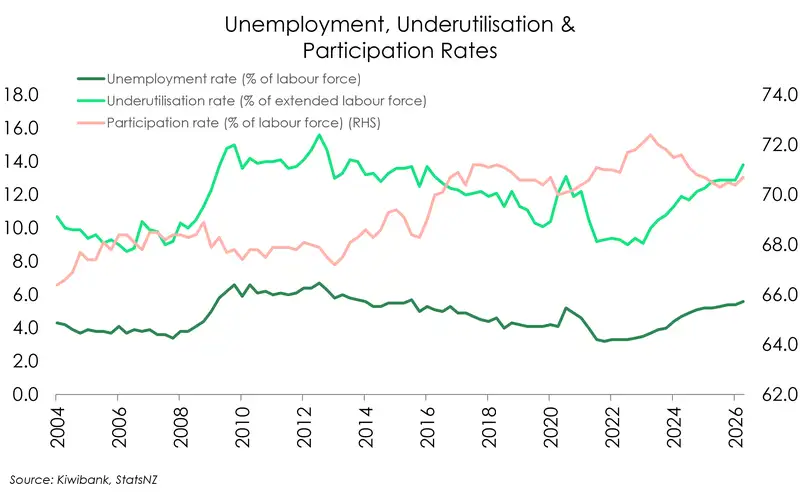
Top of mind for us is still the spare capacity our economy is trying to absorb. It’s all in the unemployment and underutilisation rates. The RBNZ noted their importance in their latest statement. The unemployment rate sits uncomfortably high at 5.6%, while the underutilisation rate is far too high at 13%.
Luckily, the RBNZ is not being too aggressive. We were pleased to see a slight downgrade in the RBNZ’s OCR track (forward guidance), acknowledging the fragility of the recovery. With a terminal rate of 3.25% by the end of 2027, we think these settings could give the economy the time it needs for the recovery to broaden.
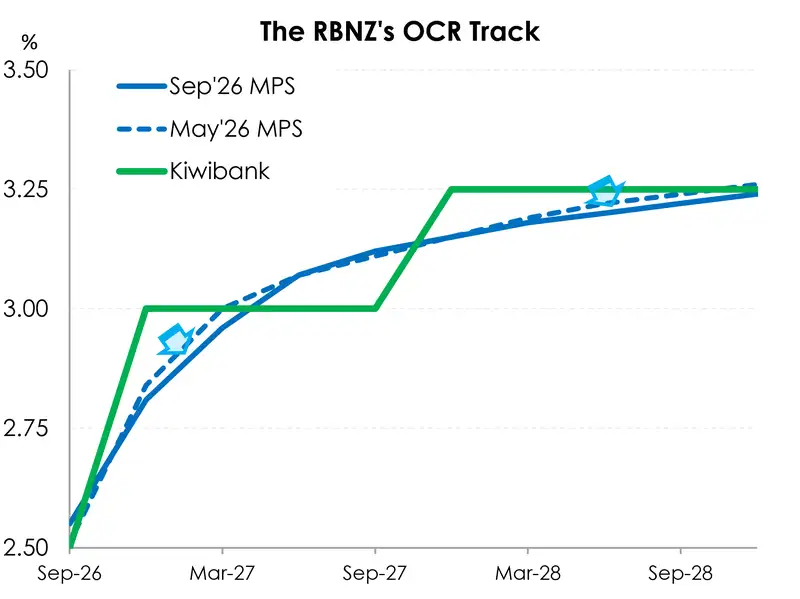
Slow and steady wins the rate race.
Interest rate markets are not pricing this steady increase, however. Traders are placing their bets that interest rates will rise faster and further than what the RBNZ has implied. There’s a 4% cash rate priced by the end of 2027. While there are some perpetually hawkish economists calling for 4%, we feel it is too aggressive. We expect the market to be reigned in by a few choice words from the RBNZ Monetary Policy Committee (again).
Of course, we can’t ignore the elephant in the room when it comes to the economic outlook: the November election.
There are two likely scenarios, and we won’t be attaching any probabilities to them. Political science is too far out of our wheelhouse. However, if the incumbent government remains in power, even with a growth in the size of the smaller parties, this will essentially be an extension of the status quo – little to no swings in rates or currencies are likely to follow (famous last words?). If we get the opposition Government forming a winning coalition, that can shake things up. The possibility of new or higher tax rates could also add more uncertainty and volatility in the mix. All in all, we could see this push the currency down in the short-term.
In the end, it’s a volatile few months ahead. The War in the Middle East is still going, the US-midterms and NZ elections are looming, and El Niño is also wreaking havoc on the environment and adding risk premiums to all sorts of commodities. Nothing is guaranteed, but we have high hopes for our resilient little island economy.
Trading view, what’s next?

Adrian Lodge – Senior Dealer, Financial Markets
The biggest change since our July FX Tactical has been the return of USD dominance through widening interest rate differentials. While the RBNZ has broadly delivered as expected, including a second OCR hike in September, the Federal Reserve has become increasingly hawkish. The September Fed hike, combined with a higher dot plot, resilient labour market conditions and persistent inflation concerns, have reinforced the view that US rates will remain higher for longer.
The September RBNZ meeting signalled an October pause, followed by a December hike, taking the OCR to around 3.00% by year-end. Beyond that, the RBNZ's projections – also matching our Kiwi Economics view, points to a relatively shallow tightening cycle, with only limited additional tightening during 2027. The RBNZ appear somewhat cautious around the strength of the economy, as evidenced by their most recent path, noting that they could take some time to assess the recent rate hikes’ impacts on the economy.
This leaves the Kiwi firmly as a relative rates story. Markets continue to price around 80bps of additional Fed tightening through 2027, while the NZ-US cash rate differential has widened back towards -125bps after briefly narrowing to around -100bps earlier this year. That widening differential has become the primary driver of the NZD/USD rate. This helps explain why the Kiwi has struggled despite stronger inflation, firmer GDP data and two OCR hikes.
A key debate now centres around whether markets are pricing too much tightening from the RBNZ. Current OIS pricing implies an OCR path closer to 3.75%-3.80% through 2027, materially above the RBNZ's 3.00%-3.25% projections. If inflation gradually moderates, a significant amount of tightening currently priced into markets would need to be unwound. Such a repricing would likely push NZ yields lower and create additional headwind for NZD/USD. Conversely, if inflation proves more persistent than expected, the RBNZ will be forced to validate current market pricing, and NZ yields would remain elevated. The NZ-US interest rate differential could begin moving back in the Kiwi's favour. In that scenario, NZD/USD would find renewed support as investors move towards a higher terminal OCR – particularly if the market sees any reason to reduce the 80bp of anticipated Fed funds moves. Positioning has also shifted materially. The record speculative short NZD position, that fuelled the rally through July and August has now completely reversed, with speculators moving net long, albeit small long. This means positioning has gone from being a tailwind to potentially becoming a headwind should investors begin reducing exposure following the Fed's renewed hawkishness.
Politically, November presents a busy backdrop. The US Midterm Elections and NZ General Election both have the potential to increase volatility. While election outcomes rarely alter long-term currency trends in isolation, uncertainty typically favours the US dollar, particularly when combined with elevated geopolitical risks and a hawkish Federal Reserve.
Scenario Analysis
|
Scenario |
Probability |
Key Assumptions |
NZD/USD Implications |
|
Central Case |
50% |
October RBNZ hold, December hike to 3.00%, Fed remains hawkish, US economy remains resilient. |
NZD/USD trades within 0.5500-0.5850, with a bias toward the lower half of the range. |
|
Downside |
25% |
Fed remains higher for longer, US yields stay elevated, NZ OIS pricing is unwound back towards the RBNZ's projected OCR path. |
A break below 0.5500 exposes downside towards 0.5200-0.5000 over time. |
|
Upside |
25% |
US inflation softens, labour markets cool, Fed becomes less hawkish, and the RBNZ validates current market pricing through further tightening in 2027. |
NZ-US rate differentials narrow, supporting a recovery towards 0.5900-0.6000 (and beyond). |
Compared with July, the market is no longer debating how much further the RBNZ will tighten – plenty is already priced. Instead, the key question is whether the RBNZ can remain sufficiently hawkish to keep pace with a renewed hawkish Federal Reserve (and a wider hawkish global central bank backdrop). Our central view remains for NZD/USD to trade within a broad 0.5500-0.5850 range through year-end. However, the balance of risks has shifted lower. Unless we see softer US inflation, weaker labour market data, lower Treasury yields or evidence that persistent inflation will force the RBNZ onto a more aggressive tightening path through 2027, the relative rates story remains firmly in favour of the US dollar.
NZD/AUD – Did I wave the White Flag Too Early?
A few months ago, the case for a medium-term recovery in NZD/AUD looked compelling. The RBNZ had restarted its tightening cycle, the cash rate differential appeared to have peaked, NZ to AU swap spreads were narrowing, and there were early signs that relative monetary policy expectations were beginning to move back in NZ's favour. At the time, it seemed reasonable to argue that the worst of the relative rates story was behind us, and that NZD/AUD could gradually work its way back towards the 0.84-0.85 region. I even waved the flag on my long-standing bet with my colleague.
Fast forward to today, and the picture has undergone a reversal. Rather than narrowing, the policy divergence between the RBNZ and RBA is widening once again – with the risk of more to come. The RBA has maintained a firmly hawkish stance, with markets pricing a near-certain 25bp hike at its 29 September meeting and growing calls for a second-rate hike before year-end. Should that eventuate, Australia's cash rate could rise to 4.85%. In contrast, the RBNZ has adopted a far more cautious tone. Recent commentary from previously supposed hawkish MPC member, Prasanna Gai, suggesting the OCR may already be within the neutral zone. This led markets to question how much further tightening is required. As a result, the current cash rate differential sits around -160bps in Australia's favour and is expected to widen back towards -185bps should the RBA deliver the hike currently priced in. More of a story could develop in future implied cash rate spreads.
Our core view had always been that NZD/AUD was susceptible to further downside. The argument for a sustained NZD recovery was largely built on the assumption that the policy gap had peaked and would gradually compress. Instead, Australia has continued to deliver stronger inflation pressures, a more hawkish central bank, and resilient commodity support. Meanwhile the market and the RBNZ don’t agree about the path of NZ's tightening cycle.
Additionally, recent bouts of risk aversion have shifted market behaviour. While both the AUD and NZD have traditionally been viewed as cyclical currencies, investors appear increasingly inclined to favour the AUD over the NZD during periods of uncertainty. The combination of higher interest rates, stronger commodity exposure, and deeper capital markets has seen the AUD outperform.
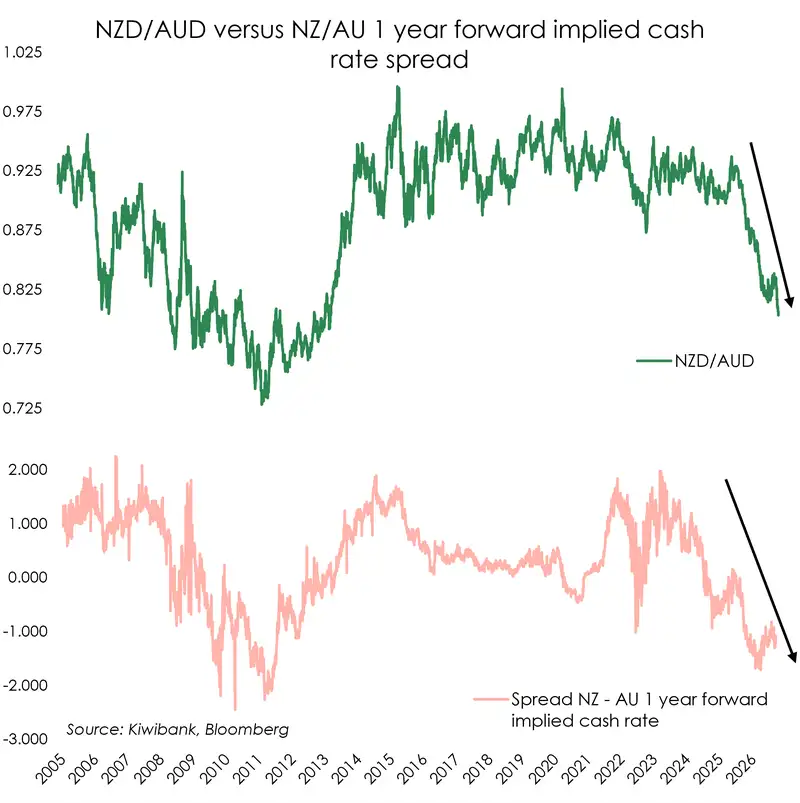
What's particularly notable is that today's market pricing is beginning to resemble conditions last seen during the 2010-2011 period, when the RBA maintained a substantial rate premium over the RBNZ. During that period, rate differentials of -150bps to -200bps saw NZD/AUD trade predominantly within a 0.73-0.82 range. Despite rate differentials trading towards those historical extremes earlier this year, NZD/AUD remains around 0.80 today, suggesting the cross is receiving support from structural factors that were less evident in the previous cycle. However, it also serves as a reminder that downside risks remain difficult to ignore should rate differentials continue widening back towards levels witnessed in 2011.
The longer-term chart highlights the close relationship between NZD/AUD and the NZ-AU 1-year implied policy differential. While NZD/AUD has already fallen sharply over recent months, the relative rates story may not have fully run its course. The current 1-year implied policy spread sits around -117bp, favouring Australia, with NZD/AUD now trading near the psychologically important 0.8000 level. Further widening in implied policy spreads could see the market increasingly question whether 0.8000 can hold.
While investors currently price NZ's 1-year implied policy rate near 3.82%, this remains some 69bp above the RBNZ's own projected OCR track of 3.13% (implied). Australia is also priced above official guidance, to lesser extent, with markets implying 4.96% versus an assumed real-time RBA stance closer to 4.75%. The market continues to demand a significant tightening premium from the RBNZ while showing greater confidence that the RBA will deliver on market expectations. This creates an asymmetric risk for NZD/AUD. If the RBNZ ultimately fails to deliver the level of tightening currently embedded in market pricing, NZ's implied policy premium has far more room to unwind than Australia's. Under official central bank guidance, the NZ-AU implied policy spread would widen from -114bp today to levels beyond -150bp. Using a more realistic assessment of current RBA guidance pushes that spread above -160bp, implying a further 20-45bp repricing in Australia's favour.
In hindsight, it appears I may have been a little premature in conceding defeat on my NZD/AUD call. NZD/AUD has earned its "widow maker" reputation for a reason, and once again it has reminded traders how quickly the narrative can change. This time is different however, the general consensus across the team is of a re-emerging downside risk in NZD/AUD.
Kiwi crosses in the months ahead
Hamish Wilkinson – Senior Dealer, Financial Markets
NZDUSD (1 year, daily) — Repeated Failures Below 0.6000
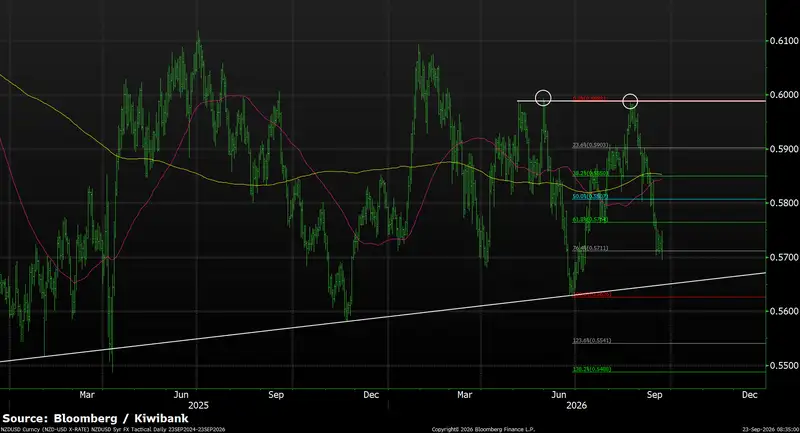
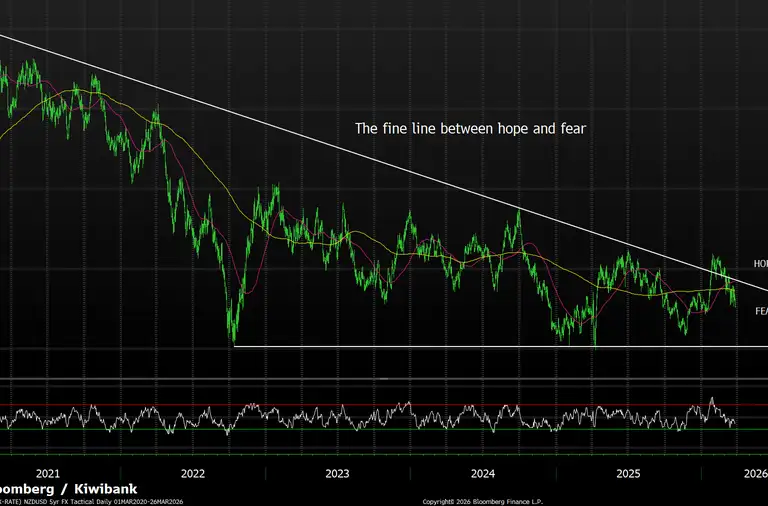
In our June FX Tactical, we noted NZD/USD was approaching an inflection point, with improving RBNZ rate expectations offset by major overhead resistance. Since then, the pair has remained trapped within a broad consolidation range, repeatedly testing but failing to break the 0.6000 region. Those repeated rejections have reinforced 0.6000 as a significant medium-term ceiling and suggest buyers continue to lack conviction at higher levels. More recently, NZD/USD has rolled over from its August highs and fallen back below both the 55-day and 200-day moving averages, signalling a deterioration in momentum. From a technical perspective, the focus now shifts towards support at 0.5700/10, followed by the June low near 0.5620 and rising trendline support in the mid-0.5600s. A decisive break below this support zone would complete a bearish range structure and increase the risk of a move towards 0.5500 and potentially lower over time. On the topside, NZD/USD would need to reclaim the 0.5800-0.5850 region before another challenge of the well-established 0.6000 resistance area becomes likely. For now, the chart suggests the broad range remains intact, but with risks increasingly skewed towards the lower end of that range.
NZDAUD (30 year, monthly) — Gotta Know When to Hold 'Em? Our Little Bet Would've Paid Out Below 0.8000
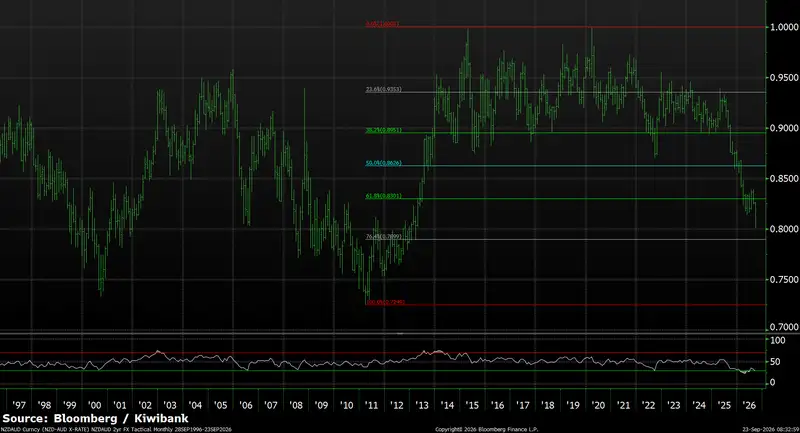
In our June FX Tactical, we suggested NZD/AUD was attempting to build a base above 0.8140-0.8200, with the broader downtrend showing signs of exhaustion. Instead, the recovery failed to materialise, and the cross has since broken decisively below that support zone as policy expectations have swung back in Australia's favour. The longer-term chart highlights just how significant this move has been. NZD/AUD has now fallen through the 61.8% Fibonacci retracement (0.8301) and the psychologically important 0.8000 level is exposed, with the pair trading at its weakest levels since the early 2010s.
From a technical perspective, the breakdown leaves very little meaningful support beneath the market. While the 76.4% retracement at 0.7899 represents the next major technical reference point, below that there is effectively a period of "blue sky support" where historical trading activity becomes increasingly sparse. To the upside, the 0.84 cent mark needs to be achieved for any meaningful recovery attempt from here. This technical backdrop aligns closely with the fundamental story discussed earlier. As long as markets continue to favour Australia through wider RBA-RBNZ policy differentials and the risk of further NZ rate repricing, rallies are likely to be viewed as corrective rather than trend-changing, leaving the balance of risks skewed towards further NZD/AUD weakness. The 2011 low at 0.7249 is now visible on the distant horizon - so a move at least into the mid-high 70’s should now not be discounted.
NZDEUR (5 year, weekly) — Something Has to Give
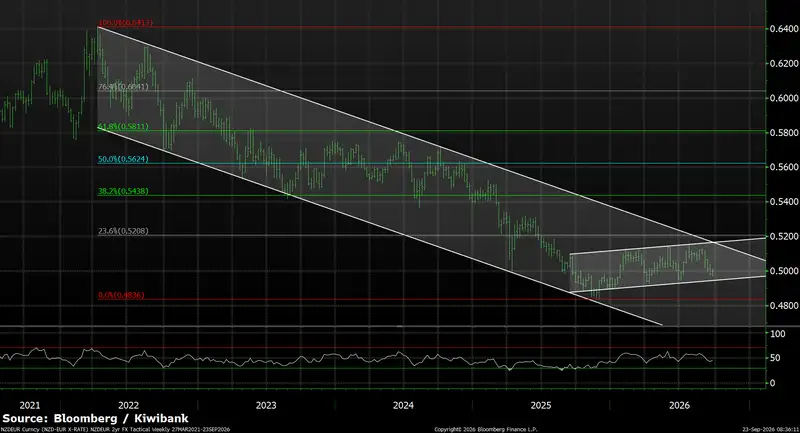
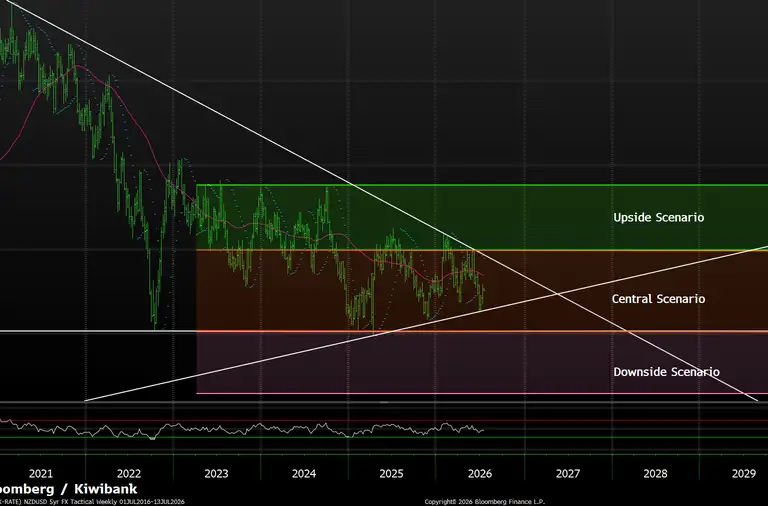
In our June FX Tactical, we highlighted that NZD/EUR was compressing into a narrowing wedge pattern and approaching a potential inflection point. Three months later, that theme remains firmly intact. Despite the ECB commencing its hiking cycle and markets currently pricing a further ~90bp of tightening over the next 12 months, taking rates towards 3.40%, neither buyers nor sellers have been able to force a decisive break from the broad consolidation range that has developed above the 0.4836 low. From a technical perspective, the chart continues to show a market running out of room. The longer-term descending channel that has defined trading since 2021 is now converging with a shorter-term rising support trendline, with both resistance structures intersecting near 0.5160. This makes 0.5160 the key level to watch. A sustained break above this area would signal that the multi-year downtrend is finally losing control and open the door towards 0.5438 and potentially 0.5624. Until then, the longer-term downtrend remains the dominant technical influence. Support remains well defined near 0.4836, while momentum indicators continue to track broadly sideways, reflecting the market's lack of conviction in either direction. For now, patience remains the key theme. However, with the opposing trend channels rapidly converging and ECB tightening now largely reflected in market pricing, NZD/EUR appears to be approaching a point where it will soon be forced to choose between another leg lower or a more meaningful recovery.
NZDGBP (2 year daily) — Stuck Between a Rock and a Pound
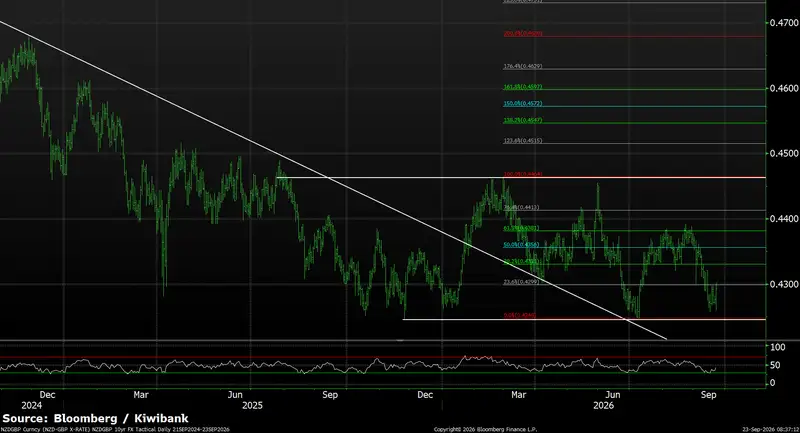
In our June FX Tactical, we expected 0.4248-0.4464 to define the range, and three months later those boundaries remain firmly intact. NZD/GBP has spent the quarter oscillating between support and resistance, with neither the Kiwi nor Sterling able to establish a decisive advantage. More recently, the cross has drifted lower from the upper end of the range, bringing 0.4248 range floor back into focus. From a technical perspective, the broader range structure remains intact. Immediate resistance is seen at 0.4300, whilst the range low at 0.4250 has repeatedly attracted buyers throughout 2026. On the topside, the previously tested 0.4380 (61.8%) is a key hurdle ahead of the major range ceiling at 0.4464. A sustained break above 0.4460 would confirm a continuation of the broader recovery and expose 0.4515, 0.4547 and potentially 0.4597. Conversely, a decisive close below 0.4248 would suggest the post-wedge recovery has lost momentum and shift the technical picture back in favour of Sterling. For now however, NZD/GBP remains a range trader's market - the chart continues to suggest consolidation rather than trend, with 0.4248 and 0.4464 remaining the key levels to watch.
NZDJPY (2 year daily) — The Yen Finally Bites Back
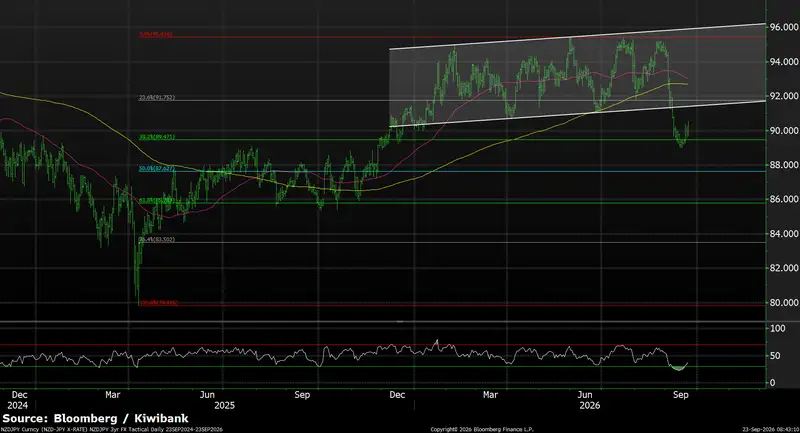
In our June FX Tactical, we maintained a constructive bias while NZD/JPY remained within its ascending channel above 91.00. While the cross continued to trend higher through the middle of the year, repeated failures ahead of 95.50 ultimately proved a warning sign that upside momentum was fading. The recent bout of Yen strength has been driven by markets finally taking Bank of Japan normalisation seriously, suspected joint US and Japan intervention saw investors triggering an unwind of Yen-funded carry trades and providing the Japanese currency with its strongest period of support in some time. That shift has weighed heavily on NZD/JPY, with the cross breaking key technical support levels despite relatively stable New Zealand rate expectations. From a technical perspective, NZD/JPY has now broken below both channel support and the 23.6% retracement at 91.75, suggesting the uptrend that defined much of the past 12 months is coming under pressure. The next key level sits at the 38.2% retracement near 89.50, which coincides closely with current price action. A break below this area would expose the 50% retracement at 87.60 and potentially 61.8% support near 85.80, shifting the medium-term bias decisively lower. While this does not yet confirm a full trend reversal, the balance of risks has clearly shifted from buying dips within an uptrend to questioning whether the broader NZD/JPY rally has finally run its course.
Glossary
Commodity currencies: include the Kiwi dollar, Aussie dollar, Canadian dollar, Norwegian krone as well as currencies of some developing nations like the Brazilian real. These countries export large amounts of commodities (raw materials like oil, metals and dairy) to the world. And commodity currencies are highly correlated with the global prices of such commodities. When the global economy is strong and demand for commodities is high, commodity prices and thus commodity currencies, tend to outperform. The Aussie and Kiwi dollars are famously known for the sensitivity to good news (risk on) and bad news (risk off).
Interest rate differentials: The difference between the interest rates earnt on two different currencies. New Zealand may offer a significantly higher interest rate than those in Japan, for example, and we see an inflow of Yen into Kiwi dollars (known as the “carry trade”). The widening, and narrowing, of interest rate differentials can have a material impact on capital flows and therefore the exchange rate.
Monetary hawk (hawkish) and Monetary dove (dovish): Characterisations of central bank monetary policy. The hawk is a bird of prey and describes a central bank aggressively raising interest rates to slow economic growth and tame the inflation beast. The peace-loving dove however, reflects a central bank trying to stimulate economic growth by cutting interest rates.
Moving averages: A common method used in technical analysis to smooth out price data by showing the average over various time periods.
Relative Strength Index (RSI): is a popular momentum indicator used by forex traders to measure the speed and change of movements in currencies. It is a useful tool to evaluate overbought or oversold market conditions, in turn signalling whether a currency pair is due a trend reversal or a corrective pullback in price. Low RSI levels indicate oversold conditions (buy signal), while high RSI levels indicate overbought conditions (sell signal).
Reserve currency: The US dollar is the global reserve currency. The dominance of the US dollar in international trade means most central banks and financial institutions hold large amounts. The majority of FX reserves are held in US dollars. The US currency and debt markets are the most liquid in the world. And liquidity (the ability to buy and sell, especially in times of stress) is important. The next most traded currency is the Euro, but it is nowhere near as popular as the US dollar. About 60% of global reserves are held in dollars, with the Euro attracting only 20%, according to the IMF.
Safe haven currencies: A safe haven currency is one where investors hide from extreme market turbulence. The US dollar tops the list of safe haven currencies. But the Yen and Swiss Franc are also beneficiaries of safe haven flows (money searching for safety). If a war breaks out tomorrow, we’re likely to see a spike in the USD, Yen, and Swiss Franc. The Kiwi dollar would be hit quite hard, and fall against these three currencies. Gold is also considered to be a safe haven asset during times of stress.
Support and Resistance levels: These are chart levels that appear to limit a currency’s price movement. A support level limits moves to the downside; a resistance level limits moves to the upside.
Terms of trade: The ratio of the prices at which a country sells its exports to the prices it pays for its imports. Put simply, terms of trade is a measure of a country’s purchasing power with the rest of the world. How many imports can be purchased per unit of exports – import bang per export buck. An increase in our terms of trade means New Zealand can purchase more import goods for the same quantity of exports. And a rising terms of trade lifts the incomes of exporters and the businesses and communities that support them.
All content is general commentary, research and information only and isn’t financial or investment advice. This information doesn’t take into account your objectives, financial situation or needs, and its contents shouldn’t be relied on or used as a basis for entering into any products described in it. The views expressed are those of the authors and are based on information reasonably believed but not warranted to be or remain correct. Any views or information, while given in good faith, aren’t necessarily the views of Kiwibank Limited and are given with an express disclaimer of responsibility. Except where contrary to law, Kiwibank and its related entities aren’t liable for the information and no right of action shall arise or can be taken against any of the authors, Kiwibank Limited or its employees either directly or indirectly as a result of any views expressed from this information.