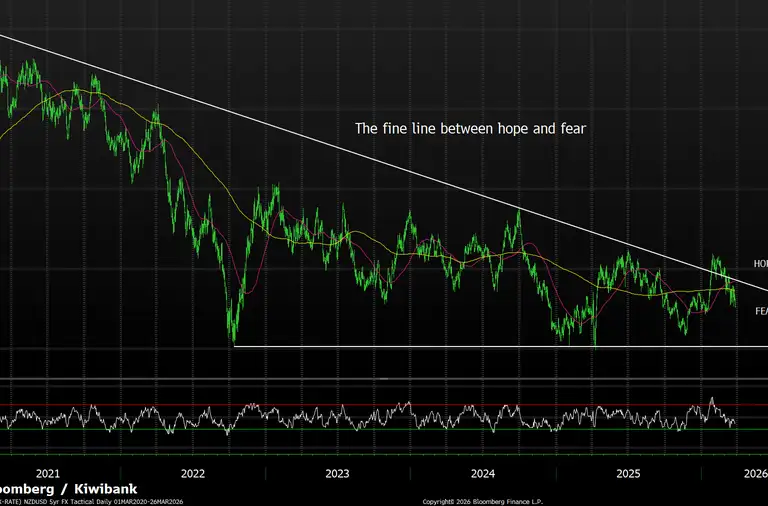

- Ongoing instability in the Middle East has driven sharp swings in oil prices. These fluctuations continue to weigh on global sentiment and introduce volatility into the NZD. This has led to the Reserve Bank’s cool resolve melting away. With the RBNZ determined to get the cash rate to neutral levels this year.
- Exporters have been getting the best of the low Kiwi dollar. Our manufacturing industry, in particular, has seen a significant boom in the second quarter of the year. The lower the exchange rate with our biggest trading partners, driving higher demand for their goods overseas.
- We have a neutral near-term view on the New Zealand dollar (NZD). While domestic interest rates are rising and offering some support, we don’t expect policy to move materially beyond neutral over the next 12 months. At the same time, global uncertainty and elevated oil prices continue to cap any sustained upside.
In our last FX Tactical, we warned of the downside risk to the Kiwi dollar from an extended Middle Eastern conflict. Since then, we’ve had to weather the many ups and downs of the war. The last few months have left us battered. As the escalations and de-escalations continue, the price of oil follows, and our heads spin.
The Kiwi dollar has been fluctuating too. And the higher it went, the better the news was for our importers, but it didn’t last long. The NZD/USD exchange rate peaked at 0.61 cents at the end of January this year, when things declined quite sharply. We came as low as 0.57 cents by early April, and fears were that we were in free-fall (lucky that didn’t eventuate). But we did eventually end up going lower, to 0.56 cents in the final week of June. Things have picked up recently off the back of the RBNZ kicking off their hiking (or neutralizing) cycle. But movement is far from dramatic.
Rate hikes were always going to be part of the story eventually, we just don’t agree with the timing. We knew we’d hit interest rate lows in November of last year, it was now just a matter of staying at stimulatory levels long enough…
In our opinion? It needed to be longer than this. Potentially the whole of this year. That was our view coming into the oil crisis. Then the war in the Middle East broke out, the Strait of Hormuz closed and the price of oil went through the roof. So, as one might expect, the price of petrol, diesel and all other petro-chemicals followed suit. Now we have the dreaded inflation monster eating away at the Reserve Bank’s cool resolve. The messaging we had from Governor Breman at the beginning of this year was one of calm and strength, and an RBNZ that was not likely to jump at shadows. But alas, their resolve has been eroded in their latest meeting in July.
It’s worth noting that some of that move was driven by a desire to keep the wholesale market from reversing. Wholesale rates had decreased further out the curve leading up to the July meeting. The recent fall in wholesale interest rates led to a slight fall in business lending rates and mortgage rates. A hold in July could have encouraged interest rates to come down further. Up to this point the Reserve Bank has been happily letting the wholesale market hold the economy down with a ghostly hand. A ghost tightening. Now things are coalescing and further hikes are likely into the end of the year. Looking ahead, we expect a further two 25bp hikes, taking the interest rate towards a neutral level of around 3% (give or take). Beyond that, the case for additional tightening weakens considerably.
That’s good news for the NZ dollar, but not if you’re an exporter. Our manufacturing industry has been making the most of the increased demand off a depreciating Kiwi dollar. The lower the exchange rate with our biggest trading partners, the bigger the sale they were getting. With the Kiwi dollar falling by ~6.1% from peak to trough between January and May of this year, you can see what we mean. We’ve seen a slight recovery since May when the RBNZ release its hawkish OCR track. However, with policy expected to top out around neutral, the rate support story is unlikely to strengthen materially from here.
This has meant that, at least for a short time, our exporters saw an increase in demand for their goods overseas, because they were cheaper to buy than before. This came through strongly in the latest Purchasing Managers' Index (PMI) data out last week. The month of June was strong, 59.7 on the index, the highest since July 2021. That upward momentum is pleasing to see, but it speaks to how uneven the recovery still is. Like a patchy lawn, we still have a construction industry that’s barren, consumer confidence in negative territory, and wages not keeping up with inflation.
Now Australia is going through a rougher patch, which might not bode as well for us on the trade front. The Reserve Bank of Australia has just finished a fresh batch of hikes to try get Aussie inflation under control. Now confidence has dropped, as has the strength of their currency, as their Reserve Bank goes on hold. Comparing that to our Reserve bank that’s just starting to hike, our currency is looking a little more attractive.
But we want to see the whole economy thriving before we celebrate and move rates higher. The reality is that the official cash rate is a blunt instrument and does not discern between Kiwis struggling to keep up with mortgage payments and a manufacturing firm looking for loans to expand its business operations. The cost of borrowing going up is a blanket covering us all, and while for some it might feel cosy, for others it is suffocating.
At this stage, we expect to see another two 25bp hikes by year end. There’s a desire to return policy to a neutral setting. We don’t know where that is exactly, somewhere around 3%. A move to 3% looks most likely, but timing is still in the air.
The increased uncertainty and high fuel costs flowing through the economy has cause households and businesses to pull back on spending. We will record a contraction in activity over the second quarter before we have a chance to recover later in the year.
One shred of silver-lining is that global growth has been stronger and more resilient than we expected. A restoration in business and consumer confidence overseas could help give the Kiwi economy a leg up. If our biggest trading partners are happy, and prosperous, so are we.
The US Federal Reserve remains a key anchor for global markets. Even as US growth shows resilience, the path of US interest rates will determine whether the USD continues to exert upward pressure on global funding conditions. For the NZD, this remains a critical external constraint.
As New Zealand’s largest trading partner, China’s growth trajectory is crucial. Any slowdown in Chinese demand would quickly feed through to weaker export performance and reduce support for the NZD.
Trading view, what’s next?

Mieneke Perniskie – Senior Dealer, Financial Markets
In our March tactical update, we warned that a prolonged US–Iran conflict could weigh on the Kiwi dollar and derail our year-end target of 0.6000–0.6100. At the time, NZD/USD was anchored around 0.5800–0.5900.
Since then, the conflict has dragged on but is now moving toward a fragile ceasefire/deal. But that fragility we are constantly reminded of, especially at the current juncture where it is threatened as ‘off again’. Despite this backdrop, FX volatility has remained relatively subdued. While the Kiwi has moved lower—particularly recently—the primary driver has been widening interest rate differentials and a more hawkish Federal Reserve, rather than geopolitics. NZD/USD is now trading in a 0.5650–0.5780 range, with the DXY recently pushing toward multi-month highs near 102, albeit now below 101.
Currency markets continue to favour the US dollar following a hawkish FOMC, and in moments of increased geopolitical concerns. The Fed remains focused on inflation and price stability, and while inflation data has been relatively benign, it has not been sufficient to justify rate cuts from the Fed. This is reflected in market pricing, with OIS indicating cuts are unlikely until mid-2027. This repricing has supported USD strength, although we see near-term resistance in the 102–103 range for the DXY.
While tensions in the Middle East may ease, risks remain. Even with a resumption of normal activity through the Strait of Hormuz, rebuilding oil inventories will take time, leaving lingering inflation concerns for central banks.
The RBNZ lifted the OCR by 25bp last week, with OIS pricing implying around 85% probability of a hike in September. The MPC signalled that further tightening is likely. This aligns with a broader shift toward a more neutral policy stance.
Looking ahead, in line with our Economics team, we see three scenarios for the NZ economy: a central case (55%), upside (25%), and downside (20%).
- Central scenario (55%): NZD/USD trades in a 0.5500–0.5950 range, driven largely by USD dynamics. This assumes the RBNZ gradually tightens toward neutral while the Fed remains hawkish and the US economy—particularly labour markets—stays resilient. USD strength caps Kiwi upside, with geopolitical risks only slowly easing. Risk sentiment may remain uneven, contributing to rangebound but volatile price action.
- Downside (20%): NZD weakens back into the 0.5500s. A break below 0.5486 (multi-year lows) would likely trigger a sharper move lower, opening the path toward 0.5000. This risk is amplified by the Kiwi’s correlation with equities, which have shown signs of strain recently, particularly in tech.
- Upside (25%): Less probable in the near term, given the slow resolution of geopolitical risks and continued USD support, keeping any recovery gradual for the Kiwi. We now see upside in the Kiwi into the end of the year limited to 0.6000 rather than the 0.6100 we had viewed previously in an economic recovery for the kiwi economy.
Our year-end NZD view has become less clear, largely due to the Fed’s more hawkish stance and the resilience of the US economy. While recent GDP data surprised to the upside, underlying conditions in New Zealand remain soft. The economy continues to exhibit a two-speed dynamic, with weak domestic demand and cost-of-living pressures weighing on momentum.
As for the NZD/AUD cross, we may have seen the bottom for now, with the cross currently anchored in the 0.8180-0.8300 levels. The RBA are broadly viewed to be on hold for the near future. If we continue to see further rate hikes in the coming months from the RBNZ, then 0.8350/0.8500 is on the cards again. That is certainly not a lofty outlook.
Adrian Lodge – Senior Dealer, Financial Markets
NZD/AUD appears to have found solid support around 0.8140/50, and the tide now appears to be gradually turning in favour of the kiwi.
The key development is the RBNZ's recent 25bp hike to 2.50%, which signals a shift away from the easing cycle that dominated 2024–2025. While the RBA cash rate remains significantly higher at 4.35%, leaving New Zealand with a sizeable yield disadvantage, the differential now appears to have peaked at -210bp (NZ 2.25% vs AU 4.35%) and is now gradually moving back in the NZD's favour, with the cash rate differential currently sitting at -185bp in Australia's favour. Similarly, the NZD-AUD 2-year swap spread has improved to approximately -90bp (from a low of -134bp as of Feb 2026), reinforcing the view that the worst of the relative rates story may now be behind us. Historically, NZD/AUD has maintained a strong relationship with the 2-year swap differential, suggesting that further compression could support a higher move in the cross.
The differing approaches of the two central banks are also worth noting. The RBA moved hard and fast to tackle inflation, while the RBNZ appears to be taking a more measured and gradual approach. If the narrowing in policy expectations continues, the recovery in NZD/AUD may follow a similar path, one of a steady gradual move higher. Then again, NZD/AUD has earned the nickname "the widow maker" among traders for a reason, and surprises are never far away.
The key risk remains the RBA. Any reacceleration in Australian inflation or economic activity that forces the RBA to resume tightening would widen the rate differential in Australia's favour and likely cap any sustained NZD/AUD recovery. For now, however, the data appears to be moving in the right direction for a constructive NZD/AUD view.
On a personal note, this is somewhat painful to admit. A few months ago, I had a standing bet with my colleague, and fellow collaborator, Hamish Wilkinson. I was firmly in the sub-0.80 NZD/AUD camp, while he maintained the cross would move towards 0.8500. Looking at the way the fundamentals are evolving, it may be time to start waving the white flag on that wager.
From a technical perspective, the 0.82–0.83 region has acted as an important support zone since March, and a sustained break above 0.83 would provide a constructive signal that momentum is turning. Until there is clearer evidence of additional RBNZ tightening or a more dovish shift from the RBA, the cross is likely to remain range-bound, with a gradual grind higher more likely than a sharp rally.
The combination of improving New Zealand economic data and potentially early signs of softening Australian data, along with the RBNZ's policy pivot, suggests the tide is slowly turning in favour of the Kiwi. While the interest rate advantage still sits firmly with Australia, the direction of travel is becoming increasingly supportive for NZD/AUD, with a medium-term move back towards 0.8400–0.8500 appearing more achievable than it did a few months ago.
Kiwi crosses in the months ahead
Hamish Wilkinson – Senior Dealer, Financial Markets
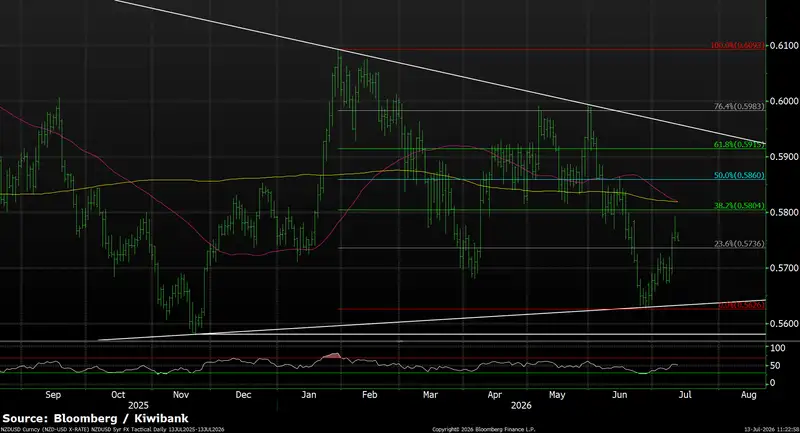
NZDUSD (1 year, daily) — Rate convergence meets formidable resistance
NZD/USD enters the new quarter caught between two increasingly supportive rate narratives. On one side, the US Dollar has regained momentum as markets have progressively priced further Federal Reserve tightening, supported by resilient US economic activity and persistent inflation concerns. On the other, the Kiwi has found support from a changing domestic rates story, with the RBNZ now commencing its hiking cycle and signalling a shift away from the easing environment that defined much of the previous few years.
For FX markets, the more important development is not that New Zealand rates are high relative to the United States—they remain at a significant discount—but rather that the direction of travel has changed. The RBNZ's tightening cycle is helping to narrow the policy and real cash rate differential that has heavily favoured the Greenback in recent years. As that yield gap gradually compresses, one of the NZD's key structural headwinds begins to diminish.
Despite this improving backdrop, the technical picture remains unresolved. Following the strong recovery from the November 2025 lows near 0.5580, NZD/USD has spent much of 2026 consolidating within a broad range. Repeated rallies have struggled beneath the long-term descending trendline(s). The market currently remains below both the 55-day and 200-day moving averages, highlighting that the recent recovery has yet to translate into a sustained bullish trend. Technically, resistance remains layered at 0.5805 (38.2%), 0.5860 (50%) and 0.5915 (61.8%). Beyond that, the 0.5980 and 0.6090 highs represent significant medium-term hurdles. Support is seen initially at 0.5735, with more important structural support located around 0.5625 where rising trendline support converges. The narrowing range suggests a market approaching an inflection point. While the developing RBNZ hiking cycle should continue to provide a supportive underpinning for the Kiwi, a sustained move higher is likely to require either a moderation in US rate expectations or a decisive break through the overhead technical resistance zone.
NZDAUD (long-term context) — Base forming at major support
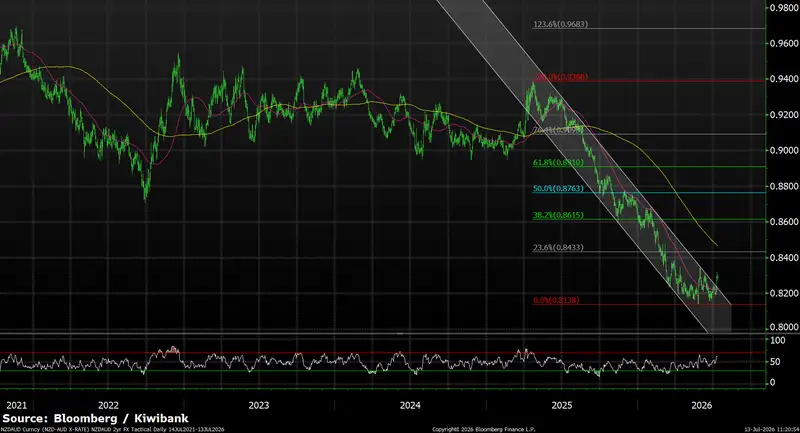
NZD/AUD appears to have found a meaningful floor around 0.8140–0.8200, with repeated tests of support failing to generate fresh downside momentum. After spending much of the past 18 months within a well-defined descending channel, the cross is now attempting to break higher, suggesting the broader downtrend may be losing steam. Fundamentally, the key shift has been a narrowing of NZ-Australia rate differentials. The RBNZ has commenced its hiking cycle, while signs of softer Australian growth have reduced expectations for further RBA tightening. While Australia continues to enjoy a sizeable yield advantage, the direction of travel is becoming more supportive for the Kiwi. Technically, the 0.8140 low remains the key structural support level. Immediate resistance sits at 0.8340 then onto 0.8433 (23.6% Fibonacci retracement), with a break above this zone opening the door towards 0.8615 (38.2%) and 0.8763 (50%). The 55-day moving average has flattened and is beginning to turn higher reversing its resistance presence observed through the broad downtrend move. Momentum indicators are improving after a prolonged period of weakness.
Tactical Bias: Constructive above 0.8140. The broader downtrend is showing signs of exhaustion, with a move towards 0.8400–0.8500 increasingly achievable if the cross can clear 0.8433 resistance.
NZDEUR (5 year, weekly) — Compression signals breakout potential
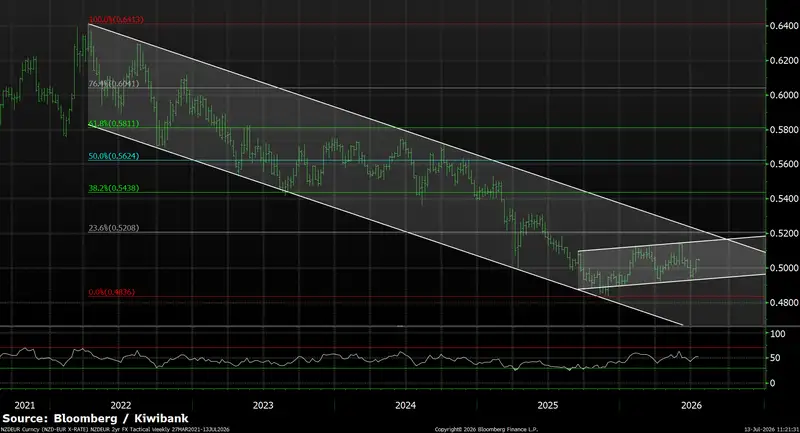
NZD/EUR has spent much of the past year consolidating above the 0.4836 low, with price action compressing into a narrowing wedge pattern as long-term trendline resistance converges with rising support. While the broader trend remains lower, downside momentum has faded considerably.
The fundamental backdrop has also become modestly more supportive for the Kiwi. While the ECB commenced its hiking cycle during the quarter, softer economic data has reduced confidence around the extent of future tightening. Combined with the RBNZ's own hiking cycle, this has helped stabilise the cross following its prolonged decline. Technically, 0.4836 remains the key structural support level. On the topside, the focus is firmly on trend resistance at 0.5150–0.5160, where both the long-term descending channel and emerging wedge formation converge. A sustained break above this region would suggest the multi-year downtrend is losing control and open the door towards 0.5438 (38.2% Fibonacci retracement).
Tactical Bias: Neutral-to-constructive. The long-term downtrend is showing signs of fatigue, with 0.5150–0.5160 the key level to watch. While 0.4836 support holds, risks are gradually shifting towards a broader recovery rather than renewed downside.
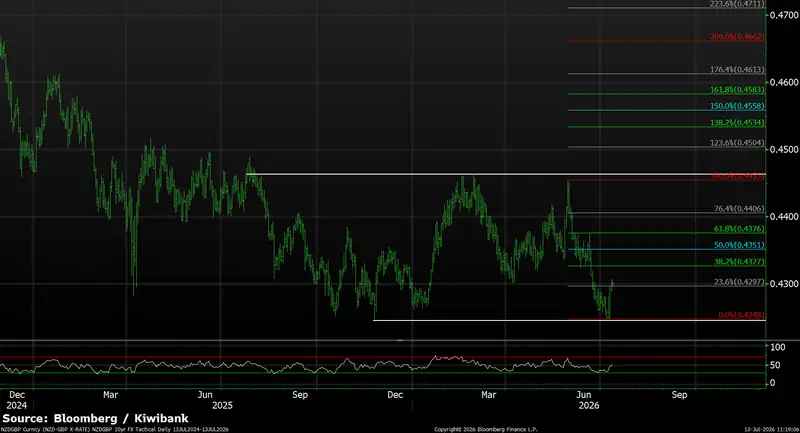
NZDGBP (quarter ahead, daily) — Rangebound, but support remains intact
NZD/GBP has spent much of the past quarter consolidating following the strong breakout from its multi-year falling wedge pattern. Having reached a high near 0.4460, the cross has since retraced towards key support around 0.4250, where buyers have once again emerged.
The fundamental backdrop remains relatively balanced. The RBNZ's hiking cycle is providing support for the Kiwi, while persistent inflation pressures and an uncertain growth outlook continue to limit the Bank of England's ability to ease aggressively. While neither currency currently enjoys a decisive advantage, the relative rates story has become more supportive for NZD than it was through much of 2025. Technically, the cross appears to be carving out a well-defined trading range. The recent low at 0.4248 represents important support, while resistance is layered through 0.4375, 0.4405 and ultimately 0.4455–0.4460, which marks the top of the recent range. Momentum has stabilised following the June sell-off, suggesting the correction may be losing steam.
Tactical Bias: Range trading favoured for the quarter ahead. Support at 0.4248 and resistance at 0.4460 should define the near-term landscape, with a break of either boundary required to signal the next directional move. While above 0.4248, the broader bias remains mildly constructive.
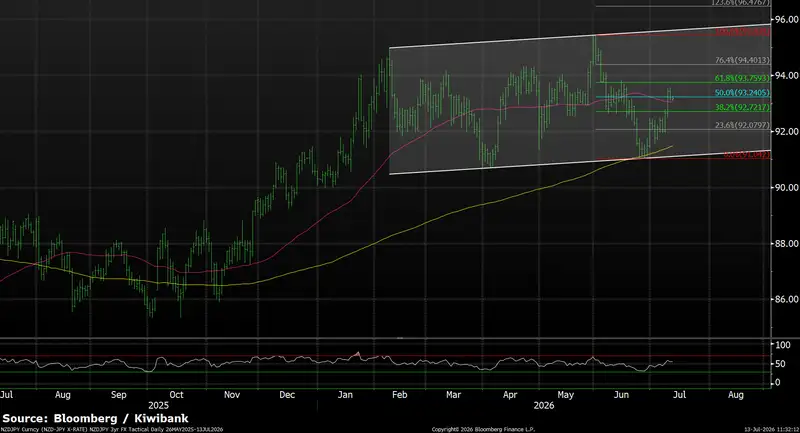
NZDJPY (quarter ahead, daily) — Uptrend remains intact
NZD/JPY continues to trade within a well-defined ascending channel, with recent weakness finding support at the lower boundary near 91.00. The broader uptrend established through late 2025 remains intact, supported by the 200-day moving average at its recent selloff and a series of higher highs and higher lows.
The macro backdrop remains supportive for the cross. While the Bank of Japan continues to signal a desire for policy normalisation, markets have remained reluctant to materially reprice the Yen higher. Instead, concerns around Japan's fiscal outlook and the long-term stability of the JGB market have continued to weigh on sentiment, particularly as higher yields increase debt-servicing pressures. As a result, the market has largely continued to sell JPY despite ongoing BOJ jawboning. Against this backdrop, the RBNZ's hiking cycle and New Zealand's improving yield outlook continue to provide support for NZD/JPY.
Technically, the rebound from 91.04 has reinforced the integrity of the broader uptrend, with support further underpinned by the rising 200-day moving average and lower channel boundary. Initial resistance sits at 93.75, ahead of the key breakout zone at 95.44, which marks both channel resistance and recent cycle highs. A sustained move above this level would signal a fresh leg higher and open the door towards 96.50 and beyond.
Tactical Bias: Constructive. The broader uptrend remains intact while above 91.00, with ongoing JPY weakness and supportive yield differentials favouring another test of 95.44 over the quarter ahead.
Glossary
Commodity currencies: include the Kiwi dollar, Aussie dollar, Canadian dollar, Norwegian krone as well as currencies of some developing nations like the Brazilian real. These countries export large amounts of commodities (raw materials like oil, metals and dairy) to the world. And commodity currencies are highly correlated with the global prices of such commodities. When the global economy is strong and demand for commodities is high, commodity prices and thus commodity currencies, tend to outperform. The Aussie and Kiwi dollars are famously known for the sensitivity to good news (risk on) and bad news (risk off).
Interest rate differentials: The difference between the interest rates earnt on two different currencies. New Zealand may offer a significantly higher interest rate than those in Japan, for example, and we see an inflow of Yen into Kiwi dollars (known as the “carry trade”). The widening, and narrowing, of interest rate differentials can have a material impact on capital flows and therefore the exchange rate.
Monetary hawk (hawkish) and Monetary dove (dovish): Characterisations of central bank monetary policy. The hawk is a bird of prey and describes a central bank aggressively raising interest rates to slow economic growth and tame the inflation beast. The peace-loving dove however, reflects a central bank trying to stimulate economic growth by cutting interest rates.
Moving averages: A common method used in technical analysis to smooth out price data by showing the average over various time periods.
Relative Strength Index (RSI): is a popular momentum indicator used by forex traders to measure the speed and change of movements in currencies. It is a useful tool to evaluate overbought or oversold market conditions, in turn signalling whether a currency pair is due a trend reversal or a corrective pullback in price. Low RSI levels indicate oversold conditions (buy signal), while high RSI levels indicate overbought conditions (sell signal).
Reserve currency: The US dollar is the global reserve currency. The dominance of the US dollar in international trade means most central banks and financial institutions hold large amounts. The majority of FX reserves are held in US dollars. The US currency and debt markets are the most liquid in the world. And liquidity (the ability to buy and sell, especially in times of stress) is important. The next most traded currency is the Euro, but it is nowhere near as popular as the US dollar. About 60% of global reserves are held in dollars, with the Euro attracting only 20%, according to the IMF.
Safe haven currencies: A safe haven currency is one where investors hide from extreme market turbulence. The US dollar tops the list of safe haven currencies. But the Yen and Swiss Franc are also beneficiaries of save haven flows (money searching for safety). If a war breaks out tomorrow, we’re likely to see a spike in the USD, Yen, and Swiss Franc. The Kiwi dollar would be hit quite hard, and fall against these three currencies. Gold is also considered to be a safe haven asset during times of stress.
Support and Resistance levels: These are chart levels that appear to limit a currency’s price movement. A support level limits moves to the downside; a resistance level limits moves to the upside.
Terms of trade: The ratio of the prices at which a country sells its exports to the prices it pays for its imports. Put simply, terms of trade is a measure of a country’s purchasing power with the rest of the world. How many imports can be purchased per unit of exports – import bang per export buck. An increase in our terms of trade means New Zealand can purchase more import goods for the same quantity of exports. And a rising terms of trade lifts the incomes of exporters and the businesses and communities that support them.
All content is general commentary, research and information only and isn’t financial or investment advice. This information doesn’t take into account your objectives, financial situation or needs, and its contents shouldn’t be relied on or used as a basis for entering into any products described in it. The views expressed are those of the authors and are based on information reasonably believed but not warranted to be or remain correct. Any views or information, while given in good faith, aren’t necessarily the views of Kiwibank Limited and are given with an express disclaimer of responsibility. Except where contrary to law, Kiwibank and its related entities aren’t liable for the information and no right of action shall arise or can be taken against any of the authors, Kiwibank Limited or its employees either directly or indirectly as a result of any views expressed from this information.