

- It’s been a year of pain for little gain. We had the makings of a recovery, and not just in a few areas. Inflation was moving back to target. And interest rates were no longer restrictive. Unfortunately, the war in the Middle East has complicated things.
- We think 2025 marked the low in interest rates for this cycle. Inflation fears mean interest rate hikes are more likely than not, and soon. It’s not what we want or need. We think it’s better to wait and see if the effects on inflation take hold, before counteracting.
- The soft labour market is weighing the consumer down. High unemployment and underutilisation rates keep a lid on wage growth despite the cost-of-living crisis. These unfavourable conditions for Kiwi workers fuel a tide of talent hightailing it across the Tasman.
- It’s not all doom and gloom. Businesses will adapt once more, and households will regather their footing. An end to the war will kickstart the recovery.
Like the small boat on international waters that we are, the Kiwi economy is braced for the swell. The domestic outlook is once again at the mercy of offshore developments. We’re navigating choppy waters.

At the end of last year, we were sailing into clear skies. We continued to forecast a robust recovery for the Kiwi economy. Interest rates had been (belatedly) set at fair levels, and we were hearing more from investors, after a few years of conspicuous absence. Household budgets were improving. Our card data showed Kiwi households having some fun, in discretionary spending. That was a good sign. And business owners were starting to see a lift in activity. It was more than just confidence, it was action.
But the tide turned sharply. The conflict in the Middle East stirred up turbulence and uncertainty in markets, and drained Kiwi households of discretionary funds. The increased costs of petrol, diesel, jet fuel and other oil-derived products (e.g. fertiliser and plastic packaging) have increased operating costs for most businesses. Demand has dropped. Businesses are feeling the pull-back from the consumer, while simultaneously dealing with price increases from suppliers. The oil price hike put increasing pressure on supply chains. In the early stages of the war, suppliers were kicking the can down the proverbial road for the next business in the chain to pass on to the next business and so on. But, eventually, the supply chain hit the final consumer. And the cash-strapped Kiwi said no.
Facing contract cancellations and project postponements, some businesses opted to re-negotiate terms. Suppliers have been forced to wear at least some of the cost (and associated risk) of the oil crisis. In many instances, new fuel surcharges have been introduced into contracts. These surcharges act as temporary fees that offset the cost of ever-fluctuating pump prices. A temporary pass-through that will drop out when the war in the Middle East ends.
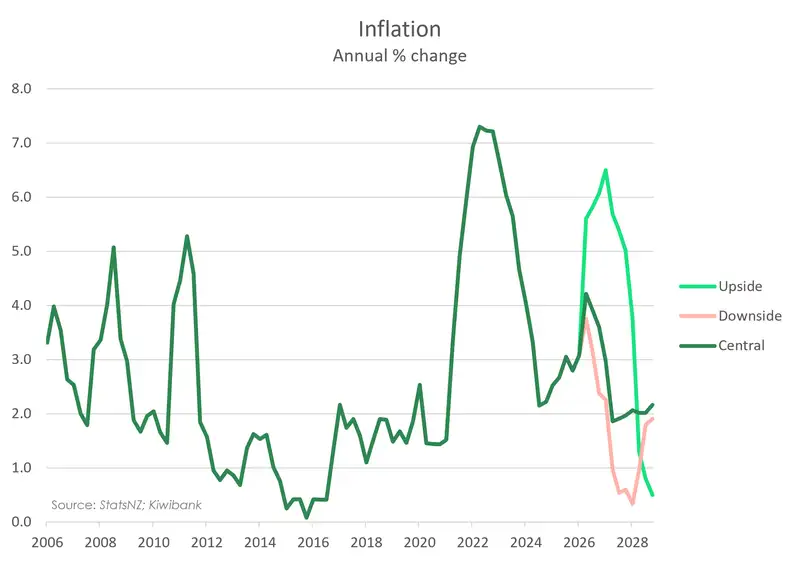
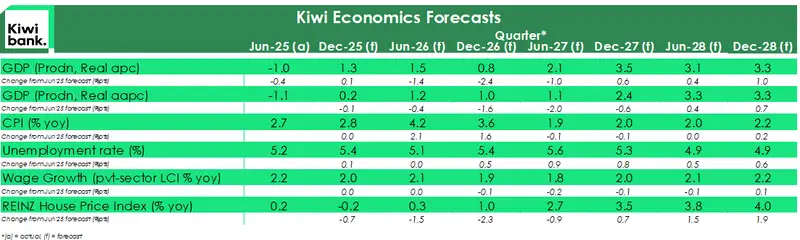
The RBNZ walks a thin tightrope. Inflation is likely to hit 4.2% this quarter. Tradable inflation, from oil-derived products, is forecast to spike to ~5.6%. Domestic (non-tradable) inflation will see a modest lift to ~3.3%, as some price pass-through works its way through. We expect most of the spike to reverse, with prices coming back down post-war.
Our call coming into this year and coming into the oil crisis was that rate hikes are not warranted. And we stand by that. We remind readers of our challenge, written here: Reckless rate hikes unwarranted. Uncertainty is up, prices are up, and the only logical next step is for demand to bottom out. We see little risk of inflation becoming embedded in the economy through wages. We have a high unemployment rate (5.4%), a high underutilisation rate (13%), and low growth. With wage growth at 2%, we’re at a low starting point. Confidence has been hit, and so to have investment intentions and hiring. Raising interest rates is tone deaf, and potentially reckless. Because both businesses and households are struggling with increased costs, not surging demand.
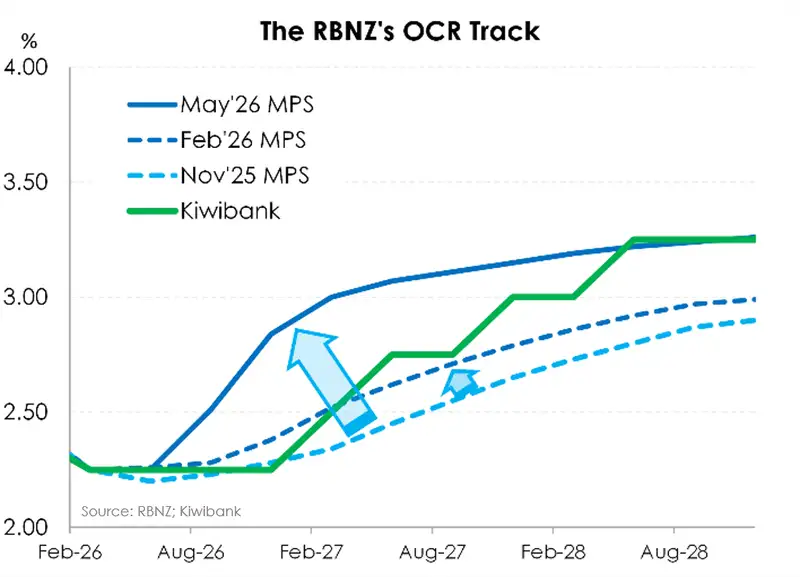
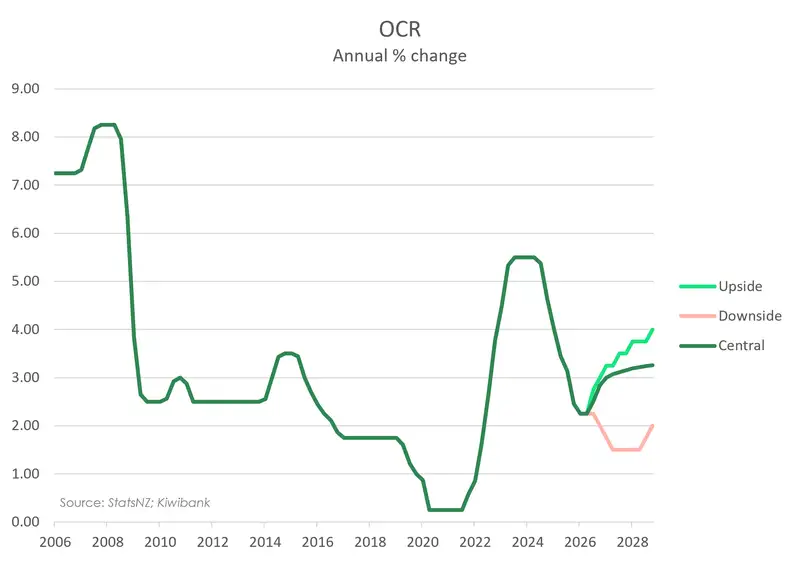
The RBNZ is cognisant of the risk that prices prove to be more persistent, and keen to tame inflation (regardless of its source). The RBNZ has lifted their forecast cash rate path… essentially matching hawkish market pricing… with a strong bias to hike to 3% by the end of the year.
The RBNZ has pivoted from having “ice in the belly”, to fire in the belly. We prefer ice. We believe this supply shock should be looked-through. There is sufficient disinflationary force from stifled demand and weak wage growth. Demand destruction deflates pricing intentions. And we forecast inflation will ease back to 1.9% in 2027. We expect the economy to begin a cyclical rebound in 2027, essentially delaying the growth we initially forecast in 2026.
Operation “Epic Fury”
On 28 Feb 2026, the US and Israel launched strikes on Iran, killing Iran’s supreme leader. That was the beginning of operation “Epic Fury”. And the Strait of Hormuz was closed.
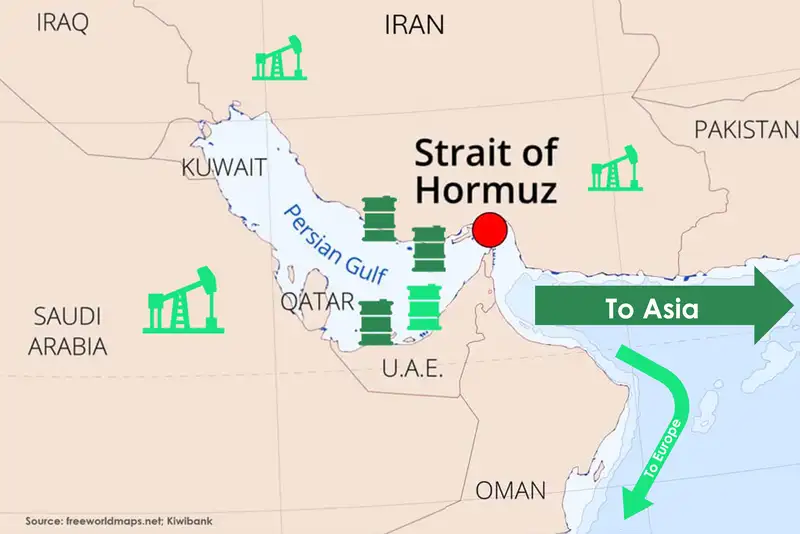
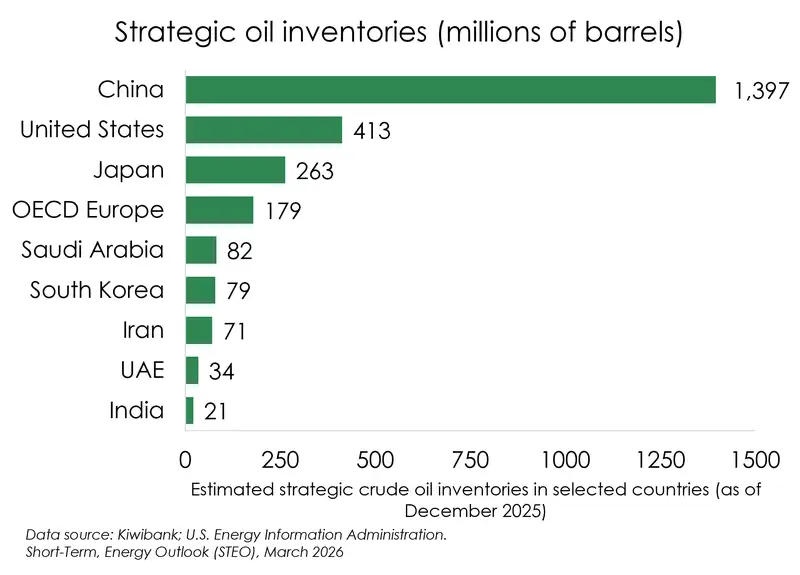
Roughly 80% of the oil pumped out of the Middle East went to the Asian market. Four countries: China, India, Japan and South Korea, accounted for 75% of oil and 59% of LNG flows out of the Strait. Japan and South Korea were most vulnerable, sourcing 87% and 81% of their oil from the region. Japan has a reasonable stockpile, but China stands out. China accumulated a massive stockpile of oil over 2025. Was it fortuitous foresight, or preparations for something else?
The good news was our largest trading partner was well stocked. The (potentially) bad news for Aotearoa was the fact we source 80% of our petrochemicals from South Korea and Singapore. The first thing on our mind was supply, supply, supply. A price hike is one thing, but running out of diesel is another. It was good to see the Government, mostly through the MBIE, act with urgency.
We found ourselves watching diesel supply like a hawk. And we continue to monitor flows as the war continues. The economy runs on diesel, for most of our domestic freight, agriculture, rubbish trucks, emergency infrastructure, marine and fishing, construction and mining. We could grind to a halt if we run out of diesel. Without diesel, farmers can’t harvest crops, and they can’t deliver milk. Unlike Covid, where essential services could still run while everything else stood still, we could see a Mad Max style scenario where diesel is rationed. Hence, the urgency to get fuel supply.
Luckily for us, global oil inventories were stacked before the war began. And it has been enough to get us through so far... Other economies have adjusted to the price also. Huge demand destruction played out in emerging economies across Asia and Africa, where price sensitivity is higher. Some economies simply can’t afford to buy petrochemicals at inflated prices.
Domestically we have also seen demand destruction. Most notably in poorer Kiwi households.
All slack and no gain makes for cost-of-living pain
The labour market remains soft. Some businesses are cutting hours, some are cutting staff. And we expect more restructuring. Fewer jobs and higher unemployment put significant downward pressure on growth, and inflation.
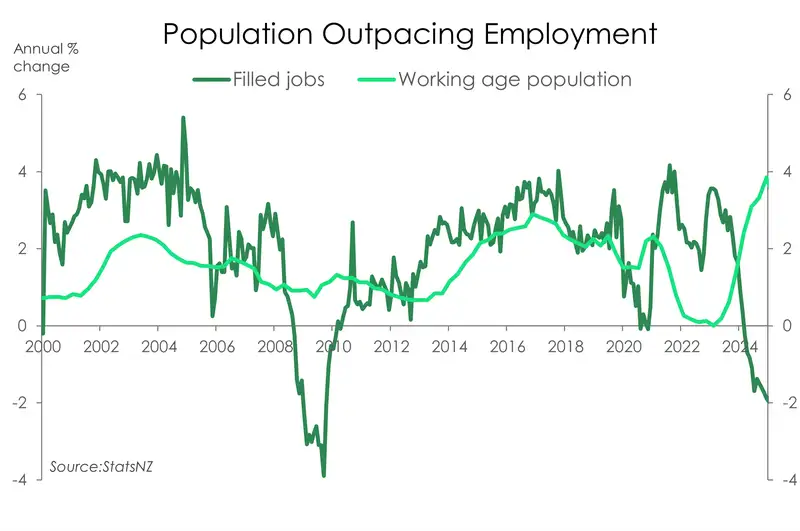
Momentum was building over the second half of 2025. And employment growth lags behind, especially after a downturn. We forecast the unemployment rate to peak at 5.6% by mid-2027.
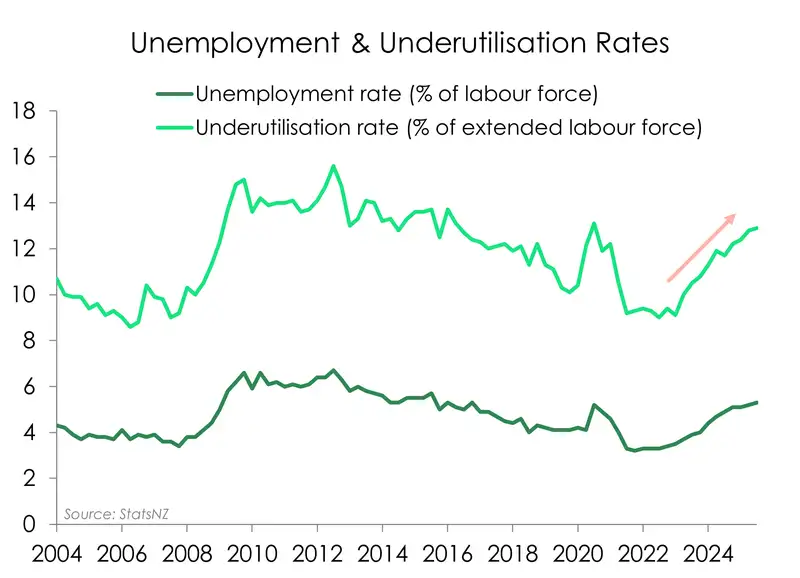
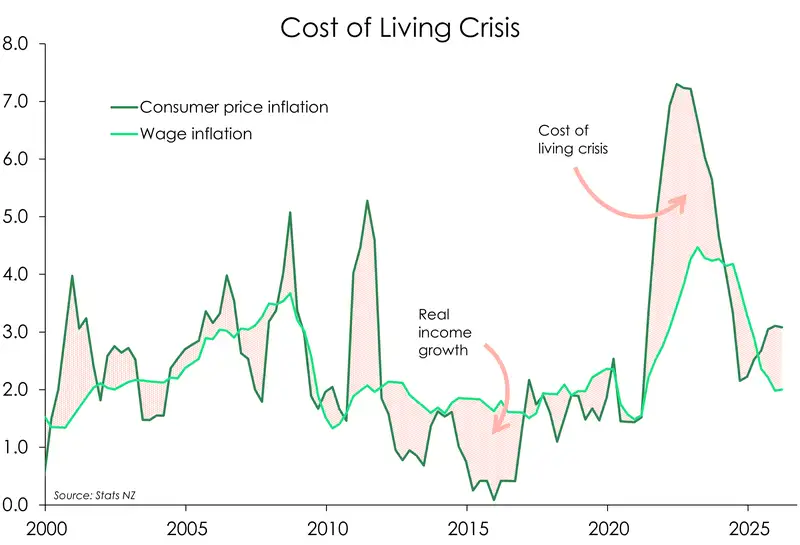
Right now, the underutilisation rate is uncomfortably high. Wage growth is uncomfortably low, at 2%. Remember the 4.3% wage increases of 2023? Well, despite the wage run rate sounding better, it came at a time of inflation bouncing between 6-and-7%. Our “cost-of-living crisis” has been with us for many a year. Far too many.
With so much slack in the labour force, we are less likely to see the RBNZ-feared wage-price spiral. The pass-through is less prominent in a soft economy. That’s one of the main reasons why the RBNZ targets medium-term inflation, not short-term.
In the meantime, that’s more pain and less gain. Kiwi families have to re-allocate existing funds to cover fuel costs, and cut back on other things. The first thing to go is discretionary spending… the fun stuff. But some households have no discretionary spend left to cut. They bear the brunt of the crisis.
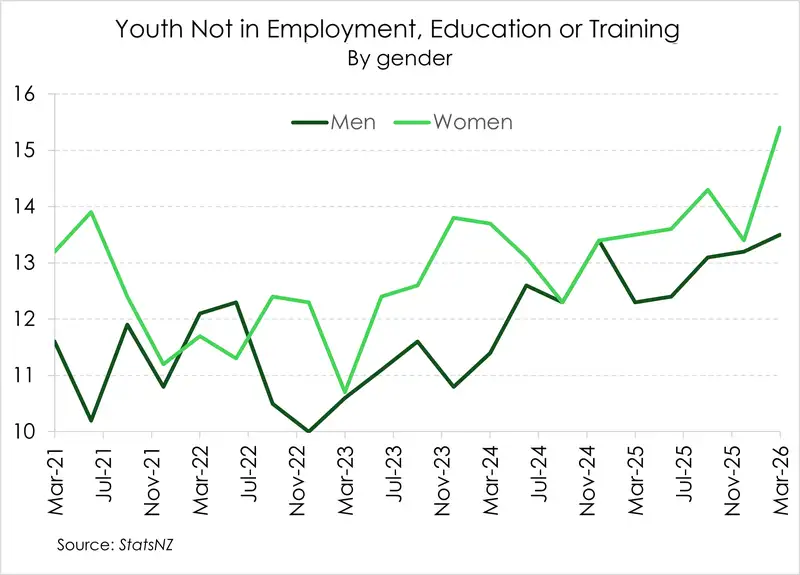
One major red flag for the economy is the rate of youth (aged 15 – 25) not in employment, education, or training. The proportion of youth in this group has been on a steady increase since 2022, with the proportion of women out-pacing men, especially in early 2026.
What do disenfranchised young people do when there aren’t enough entry-level jobs? They seek other markets. Australia is a good example of a much better placed job market. Their unemployment rate is only 4.3%, their wage growth is 3.3%, and that’s not yet factoring in a 4.75% increase to minimum wage set to kick off in July 2026.
Birds of a feather flock to better weather
Despite a growing population, net migration of Kiwi workers is still negative. More of us are leaving… and most are headed across the ditch to Australia. Over 63k Kiwi workers left NZ in the year to April 2026, while 26k returned home.
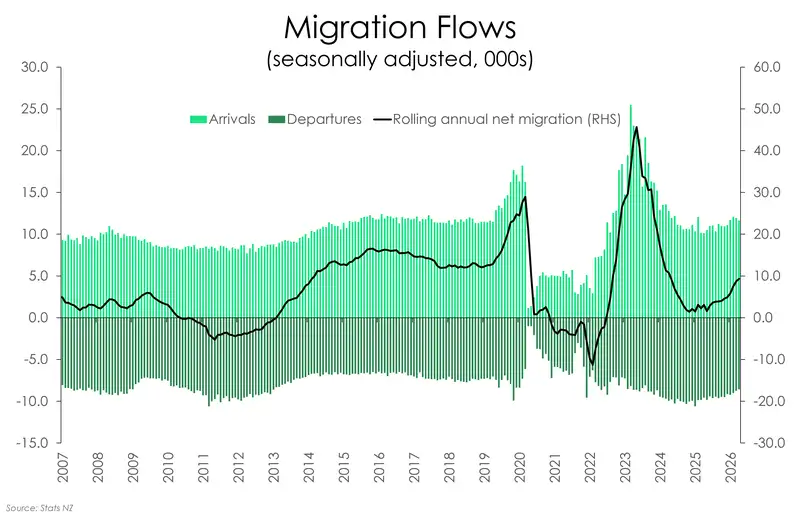
On the bright side, net migration is showing signs of picking up. Average yearly net migration is up from 13.8k in December, to 22.8k in April. We still have some ways to go to reach pre-Covid levels. April 2019 average yearly net migration was over 50k. It’s not a lack of inflows holding us back, it’s a haemorrhaging of Kiwi talent to the land of Oz.
The pull of the labour force is powerful when it comes to migration flows. Aussie jobs growth is strongly positive, and Aussie wage growth outpaces Kiwi wage growth.
Growing Pains and AI Gains
Our economic recovery has taken a hit, again. To say we are frustrated is an understatement. But it’s not looking as grim as we had initially feared. The Kiwi economy grew 0.8% in the March quarter of 2026. With a revision to the 2025 December quarter (up to 0.5% from 0.2%), placing it in a strong(er) than expected position. Economic activity lifted 1.5% over the year, compared to our forecast 0.8%. The economy was gaining momentum coming into the oil crisis. Around 75% of the upward revision to the December quarter was due to revisions to building activity estimates, the remainder was mostly due to revisions to agriculture.
In March, 9 of the 16 industries reported solid growth. One of the biggest industries to grow was manufacturing, up 1.9%. There were strong gains in transport equipment and machinery manufacturing. But wholesale trade, also driven by machinery and equipment wholesaling, was up 2.4%. Business services grew 1.1%, largely driven by advertising, market research and management services. Computer system design also contributed. With computing services up, along with purchases of computing hardware, AI related activity is beginning to show up.
On the expenditure side, we had a large uptick in plant machinery and equipment (5.5% qoq), largely driven by computers, including imports. Again, we may have the AI revolution to thank for some of this growth in expenditure. Expenditure on transport and equipment lifted 6.7% qoq, a huge jump from the -11.4% we saw in December. Business investment also saw an up-tick of 3.7%.
This is good news. Because, for the first time in a long time, the construction drag is being offset elsewhere. Expenditure on residential buildings was down 3.1%, while non-residential building was down even more, 3.4% compared to December. Construction was down 1% qoq. No surprises there, given the anecdotal evidence coming into this year. We are, at least, a little more than an economy of “a housing market with bits tacked on”.
With that good news behind us, we foresee a contraction in activity over the June quarter, delaying the expansion into 2027. We say it again, this is not a situation warranting rate hikes. We’re aiming for 2.1% growth rate in 2027 and 3.1% in 2028. Beyond 2028, we forecast a normalisation in growth back towards trend.
Build It (On Paper) and They Will… Wait
We now expect a further delay in housing market activity before things pick up again. The 2026 election and oil crisis add uncertainty for developers and buyers. RBNZ rate hikes will also keep the lid on housing activity until mid-2027. The global outlook is murky near-term, as the war in the Middle East destroys demand. This further reduces medium-term inflationary pressures. Import prices will likely increase as exporters in other countries price in the increased costs from the fuel crisis, however this will be somewhat counter-balanced against weak global demand.
Housing consents rose, while building work fell during the start of the year. In April, consents were up a solid 16% over the year. And it was good to see more than half of the consents were higher density (arguably more affordable) homes. Auckland saw 21% growth behind Canterbury at 29%, and even Wellington recorded a gain of 13%. But good news is slim pickings for construction. Construction activity is still uneven, to put it politely. The spike in diesel added to elevated building costs (up 15%), and is causing many developers to postpone or cancel projects.
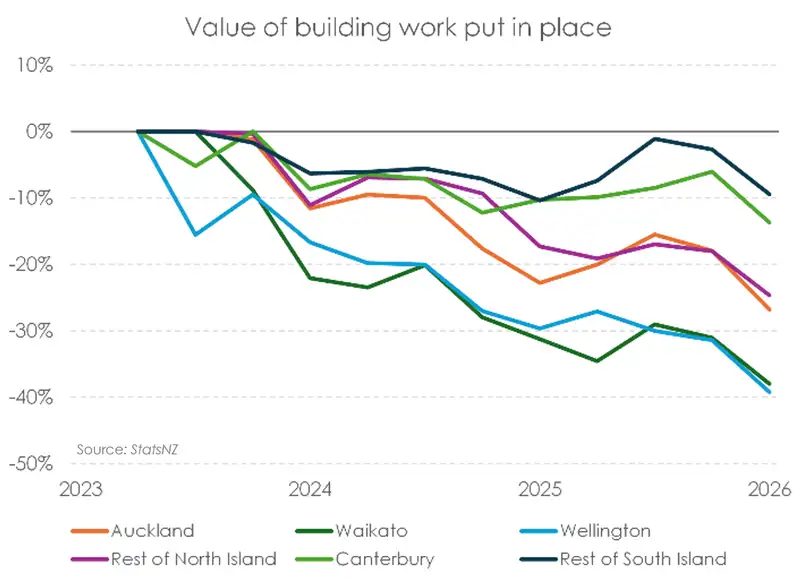
The value of building work put in place has taken a sharp downturn across the motu. The data is simply weaker than expected. And the data is adding downside risk to growth estimates. Over the quarter, Canterbury has taken the sharpest fall. It’s a surprise, given the standout performance of the region. Maybe we’re at a turning point, but the garden city (Chch in green) is still a top performer. Canterbury feels like another country, compared to the North Island. From peak to trough, Canterbury is down 14%, second only to other regions south of the border. In the North Island, things are a lot worse. Wellington is the weakest, down 39%, Waikato is down 38%, and Auckland is down 27%. These are miserable numbers, and show three years of contraction. Our argument is simple: the RBNZ needs to allow the industry to recover.
The Kiwi housing market is no longer moving as one. The latest data highlights a striking (and growing) regional divide, with the South Island pulling away from the North.
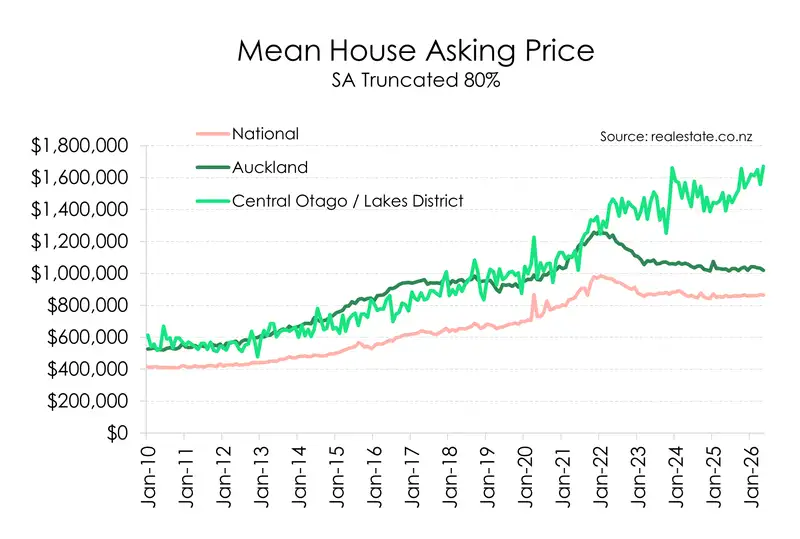
At the centre of it all is Central Otago and the Lakes. Average asking prices have surged to around $1.67m, a fresh record and more than 20% higher than a year ago. A decade ago, this region was cheaper than Auckland. Today, it’s roughly $650k more expensive. That’s not just a shift—it’s a structural reordering of the housing ladder.
The drivers are well understood. Queenstown and Wānaka continue to command premium prices north of $2m and $1.7m respectively, powered by lifestyle appeal and a steady inflow of high-income buyers. Hybrid working has only amplified that trend. Location is no longer tethered to employment in the way it once was.
Meanwhile, Auckland tells a very different story. Prices are broadly flat, sitting just over the $1m mark, with little momentum. The market has stabilised after a sharp correction, but there’s no clear catalyst for a strong rebound. Higher interest rates, stretched affordability, and cautious buyers are keeping a lid on gains.
What if we reasoned all these what-ifs away?
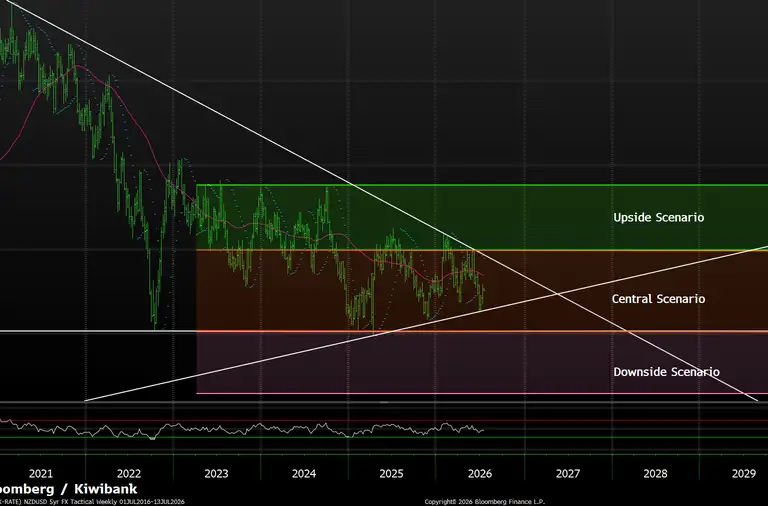
You can’t have a good economic outlook without a dose of speculation. And what better way is there to speculate than via scenarios? We present two alternative realities below, one downside and one upside.
We would weight our central scenario at 55%, with 20% downside and 25% upside. So, we see some upside risk.
The downside scenario
In a downside scenario, highly disrupted international trade and domestic demand destruction hits the economy, hard, and a negative spiral ensues. The probability of this scenario has been reduced, markedly, with the stability in financial markets. But we would still put it at an uncomfortable 20% chance (although down from 35%).
A downside scenario sees a deeper slowdown in global growth, complicated by supply disruptions, and the Kiwi economy falls back into recession. A weaker economy leads to a deeper deterioration in the labour market. And the unemployment rate spikes to 6.6%. The housing market would weaken, again, and prices contract.
A more negative output gap results in inflation falling to 1% by 2027/28. Our downside scenario assumes the RBNZ (re)commences a cutting cycle, rather than hiking as they have indicated. Because inflation undershoots their target.
The upside scenario
Our upside scenario assumes a swift “bounce back” in the domestic economy. As oil prices normalise, business and consumer confidence improves, leading to firmer investment intentions and household spending. The probability of an upside scenario has increased, with the fall in oil prices, and possible end to the war. We would put it at a 25% chance.
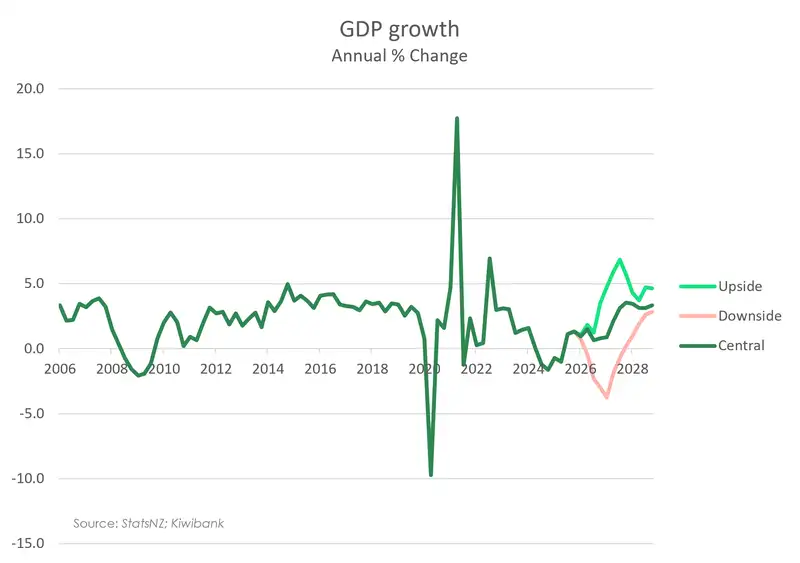
Some price increases brought in to cover the costs of rising oil prices remain and help restore margins as demand picks up. Economic activity lifts and employment growth rebounds in 2027, resulting in a faster descent in the unemployment rate.
The housing market gains momentum, leading to a strong 7% gain over the forecast period. The wealth effect returns. The output gap turns positive, for the first time in a long time. Inflation reaccelerates, rising to 5.6% in the third quarter of 2026 and accelerating further above the RBNZ’s target band. Our upside scenario assumes a heavier hiking cycle for the RBNZ, with the cash rate rising to 3.25% in 2027 and then up to 3.75%, to combat high inflation.
All content is general commentary, research and information only and isn’t financial or investment advice. This information doesn’t take into account your objectives, financial situation or needs, and its contents shouldn’t be relied on or used as a basis for entering into any products described in it. The views expressed are those of the authors and are based on information reasonably believed but not warranted to be or remain correct. Any views or information, while given in good faith, aren’t necessarily the views of Kiwibank Limited and are given with an express disclaimer of responsibility. Except where contrary to law, Kiwibank and its related entities aren’t liable for the information and no right of action shall arise or can be taken against any of the authors, Kiwibank Limited or its employees either directly or indirectly as a result of any views expressed from this information.