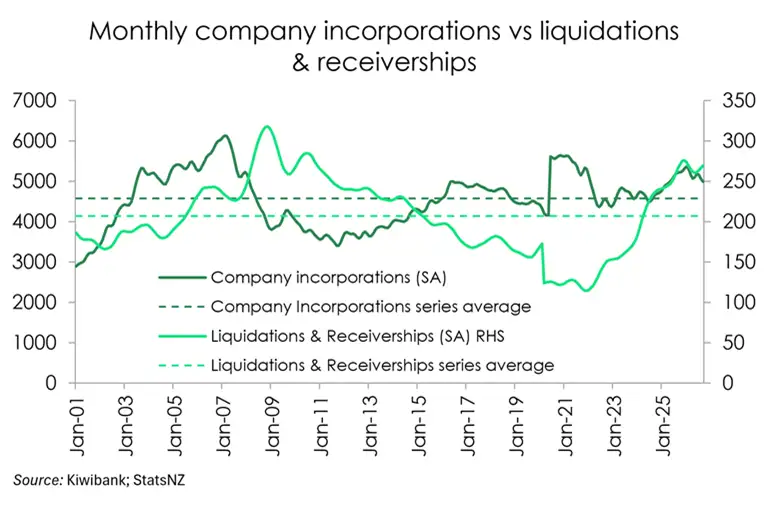

The job market data out last week wasn’t pretty. Beyond the unemployment rate rising to an 11-year high, one particularly worrying trend was lurking in the data.
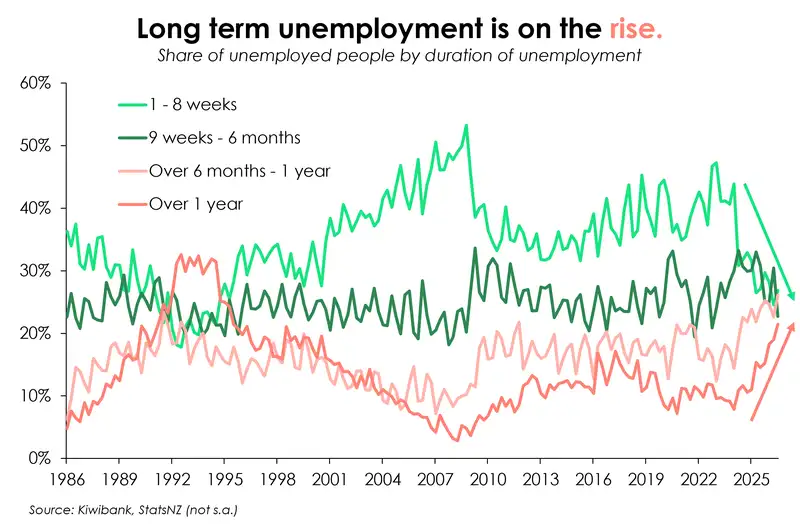
It’s widely known that the unemployment rate rose over the September quarter, from 5.6% to 5.7%. The push higher, not lower, defied the expectations of almost all economists. But unemployment is not black and white. People can become unemployed for numerous reasons and durations. While unemployment of any kind can be economically and psychologically harmful, long-term unemployment is particularly bad. It’s hard keeping up with industry developments, maintaining skills and confidence, and dealing with employer perceptions the longer you’re out of work.
Over 1 in 5 unemployed Kiwi (21.5%) reported being unemployed for more than a year, according to the Household Labour Force Survey. That’s 36,300 Kiwi out of work for more than a year, facing long-term unemployment. The last time we had a long-term unemployment rate higher than that, was in June 1995 (when it was 24.3%).
Arguably, an even more staggering figure is that over 1 in 4 unemployed Kiwi (26.1%) have been unemployed for somewhere between six and 12 months. That’s the highest proportion ever recorded since the series began in 1986. While six to 12 months might not be considered long-term unemployment by official definitions, the fact that its reaching record levels is worrying. It’s a direct pipeline into long-term unemployment.
At the same time, shorter term unemployment (one to eight weeks and nine weeks to six months) has been on the decline. Some unemployed workers are getting jobs quickly, but others are slipping into the longer term.
The chart says it all. The dynamics of unemployment have changed dramatically in a relatively short period of time.
Between 2010 and 2024, the shares of unemployed people corresponding to the different durations were pretty stable. Frictional unemployment, those unemployed for short durations between jobs was relatively high. The cyclical downturn we’ve been experiencing since 2024 has hit the labour market hard. The shift points to increasing structural unemployment, when workers do not match available job skills or locations. That is deeply worrying and much harder to fix. Kiwi workers are relatively mobile, able and willing to move to new roles, but we’re another state of Australia when it comes to work. Kiwi are leaving in droves.
Long term unemployment can cause workers to become discouraged and drop out of the labour force completely (i.e. stop looking for work). Long periods of time spent outside of the labour force makes it even harder to find a job. After a year of unemployment, employers might start to question how up-to-date a candidate’s knowledge is, how long it would take them to get up to speed, and if the cost of re-training the re-entrant is worth it.
While people can point to double digit unemployment rates in times past, and say that things aren’t all that bad now, data like this gives nuance that a headline unemployment rate can’t. An increasing proportion of Kiwi are finding themselves persistently unemployed. At the same time, youth unemployment rates are around global financial crisis levels. New Zealand clearly has some work to do to turn the labour market around.
All content is general commentary, research and information only and isn’t financial or investment advice. This information doesn’t take into account your objectives, financial situation or needs, and its contents shouldn’t be relied on or used as a basis for entering into any products described in it. The views expressed are those of the authors and are based on information reasonably believed but not warranted to be or remain correct. Any views or information, while given in good faith, aren’t necessarily the views of Kiwibank Limited and are given with an express disclaimer of responsibility. Except where contrary to law, Kiwibank and its related entities aren’t liable for the information and no right of action shall arise or can be taken against any of the authors, Kiwibank Limited or its employees either directly or indirectly as a result of any views expressed from this information.