


- The Kiwi currency has come under downward pressure, with a late rally in rates from the RBNZ. After flip-flopping, again, the RBNZ is set to deliver more (and more) cuts to the cash rate. Relative to the US, both central banks are cutting. Relative to Australia, the RBNZ is cutting by more.
- A soft USD is supporting the NZD, but the Kiwi flyer has dipped back below 59c and may test 58c in time. If we get 75bps of RBNZ cuts this year, compared to 50 in the US, there should be some room to move lower, possibly below 58c. Against the Aussie, it have been a cleaner play. The Kiwi has fallen from over 93c to below 89c. That’s a big move that will help Kiwi exporters, and Kiwi’s living in the outback.
- We have so much to discuss.
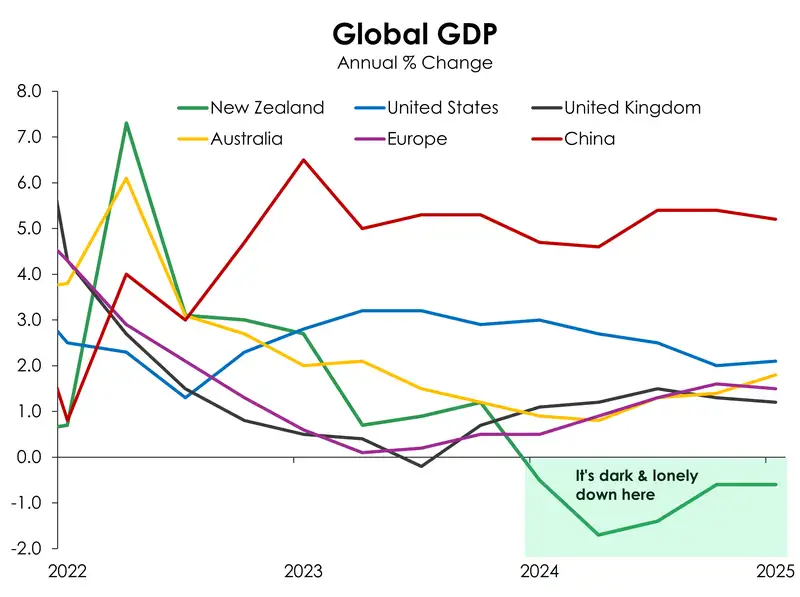
There’s no other way to put it: the Kiwi economy is underperforming. It’s underperforming our already weak forecasts. And it’s underperforming our peers around the world. It’s saddening to see an economy still contracting after last year’s deep and destructive recession. We fell into a hole then, and we’ve only dug ourselves deeper.
Compared to June last year, the economy has shrunk a further 0.6%. That compares to growth of 1.8% in Australia, 2.1% in the US, 1.2% in the UK, and 1.5% over the EU. Naturally, our relative underperformance has seen the NZD weaken against most of the key crosses.
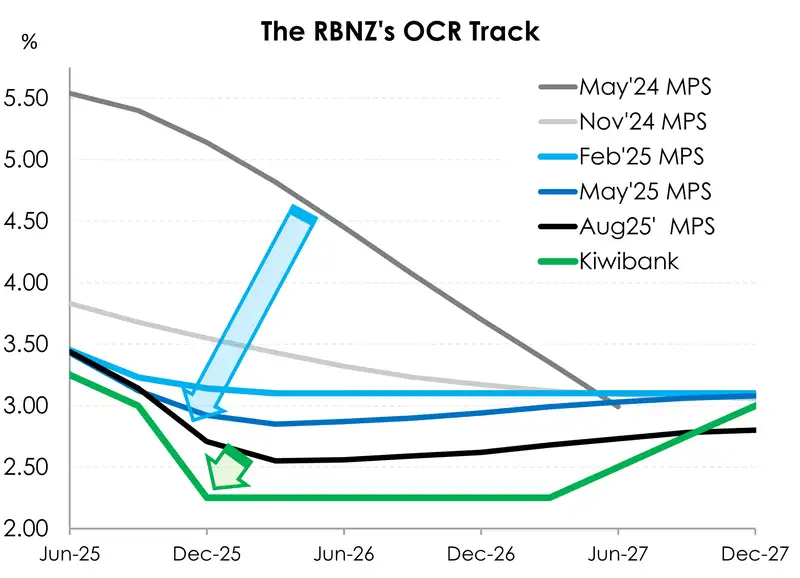
The significant drop in activity proves, once again, that the RBNZ has not delivered the appropriate monetary policy setting. The 250bps of cuts to 3% is a lot, but it is simply removing restraint in monetary policy. Stimulus has not yet been deployed. But it’s crystal clear that our lacklustre economy and fragile recovery requires an accelerant.
We expect a 50bps cut in October, followed by a 25bps cut in November. The cash rate should end the year at 2.25%. From there, we think there’s about a 50/50 chance of a further move to 2% in February. It will depend on how the data and recovery plays out. This summer will be an important time for data watching. Will the housing market pick up? Will consumer confidence lift into consumption? And will business confidence translate into activity? It will all feed into the February decision. We hope it will.
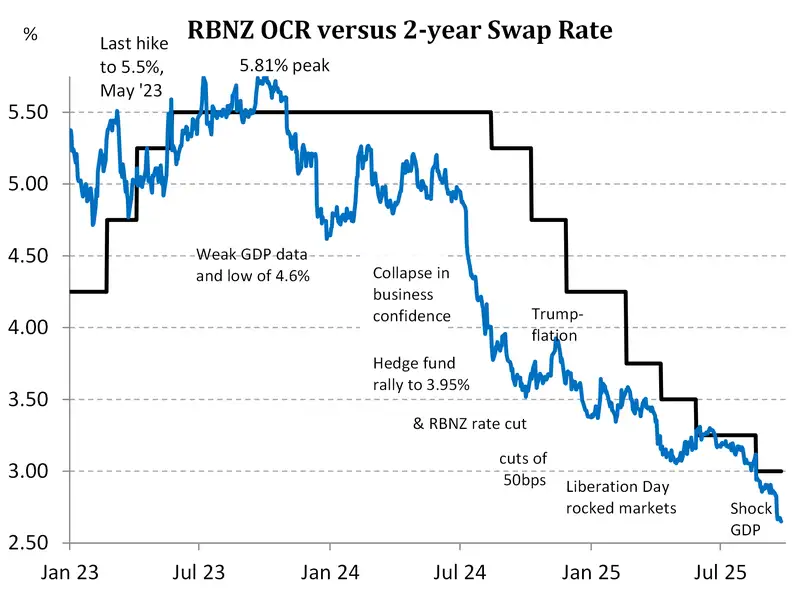
As we detailed in a recent episode of Markets, Mystics and Mayhem, titled “Just do it: 75bps needed now”, rates markets have reacted violently to the change in expectations for the RBNZ. The OIS strip has a terminal rate of 2.28%, well below the 2.6% prior to the GDP report. The 2-year swap rate has subsequently fallen to 2.67%, from 2.86%. Those are big moves. And they’re not yet at the bottom. The market only has a 2.4% rate priced by November. Not the 2.25% we expect, meaning the 2-year (currently at 2.67%) has room to fall further, towards and possibly below 2.5%.
Our relative underperformance and the call for more cuts has seen the Kiwi flyer lose flight. Against the Greenback, the Kiwi may trade with a downward bias from here. Because the 75bps of easing we expect the RBNZ to deliver this year is not yet fully priced into rates markets. However, to some extent the move south is capped by the US Fed returning to the cutting party. In September, the Fed cut rates for the first time this year, and signalled another 50bps by year-end. Further Fed easing provides some upside support which could prevent the Kiwi from dipping back down to the April lows of 55c. But we wouldn’t be surprised to see the Kiwi with a 57-handle this year. Just as we’ve seen a delay to the Kiwi economy’s recovery, the return to 60c will also take more time.
Larger moves are likely for the NZDAUD with strong interest rate differentials in play. Right across the curve, Aussie rates remain well above Kiwi rates. The RBA have delivered less and remain cautious around the timing of further cuts. Just one more 25bps cut to 3.35% is expected by year-end. And fair enough, the Aussie economy continues to hold up well. But the same can’t be said about us. The path ahead for the RBNZ is clearly lower with further rate cuts coming thick and fast. With further rate cuts priced in domestically following our shocking GDP numbers, the growing spread between Kiwi and Aussie rates has already seen the NZDAUD break below previous trading ranges and fall to a three-year low of .8865. And we expect continued downwards pressure to weigh on the cross towards 87c as markets fully price in the 75bps of easing from the RBNZ to come. Even more so if a move below 2% is required.
Trading view, what’s next?
Mieneke Perniskie – Senior Dealer, Financial Markets
The US Dollar and the Fed have been long time features for Kiwi dollar direction, and this coming quarter is no exception. Of late the US Dollar has found solid support after some heavy tariff news related pressure earlier in the year. In addition to this backdrop there had been some solid expectations around decisive cuts from the Federal Reserve in 2025, but this has not come to fruition following the uncertainty of the inflationary impacts from tariffs. The Fed was less dovish last week than market participants were looking for, and this has also helped lock in some support for the Greenback. The DXY should in the short term trade in the 96.50-98.00 levels. This theme may change of course, if we do see a delivery of what was indicated in the Fed’s ‘dot plot’, namely a further 50bp of easing in 2025. Beyond that we see potential downward pressure next year if the new Fed Governor (yet to be announced) kowtows to political pressure. This is not hard to envision given the dissenting vote we saw from Stephen Miran (he voted for a 50bp cut) last week, and in subsequent speaking events. Going forward, any softening in US data will come into play, supporting the Fed cut outlook. Beyond that there are the fiscal concerns, which have not gone away, and now there is talk of a “third mandate” for the Fed, in which an additional goal for the Fed would be to help ‘moderate longer dated interest rate costs’. We have seen some turmoil surface in bond markets this year, generally driven out the UK gilt market, but this could well rear its head again for the US. We see this as more of a 2026 story though, with moderately smooth sailing in the next 3 months. In short, we see there are risks building for a resumption of the lower US dollar rhetoric, and this will provide some backing for the Kiwi dollar.
The RBNZ’s dovish pivot, and the shocker Q2 GDP print last week have seen the Kiwi dollar move back into the lower end of its recent ranges. But it has remained supported at key technical levels (0.5803/0.5860), even with a growing expectation of 75bp of cuts from the RBNZ by Christmas. It is now entirely possible that a 2.00% OCR is on the table in early 2026 if we don’t see some improvements in the Kwi economy. But first we need to see what is delivered by Christmas. We see some further downside for the Kiwi, into the 0.5700’s, but a resumption in US Dollar weakness could provide further support for the Kiwi on the downside. Overall, our views around the NZDUSD have not been drastically altered from our previous quarterly update. A cap to Kiwi upside is the major update.
Of more interest to us, is the NZDAUD cross. The cross has now traded through the multiyear support level of 0.8950, the catalyst being the soft NZ GDP print, which has brought expectations of speedier cuts from the RBNZ. Prior to the breach of this support the Kiwi had already been under pressure versus the Aussie after the RBNZ’s dovish pivot in August. It had a definitive dive lower as interest rate differentials had a lot more at stake, with a clear divergence in direction between central bank policies now expected. The NZ GDP print was proof that we are in a worse position than initially estimated, so the next move lower we’ve just seen makes sense. The NZDAUD cross is now back looking at the lows seen in late 2022. The next targets are 0.8890; 0.8830; and then 0.8700. In the meantime as we watch to see what actually plays out we see the cross likely to trade between 0.8830 – 0.9000 max in the short term. There is also the factor of the RBA to consider. They are reluctant to cut too quickly. Current market pricing indicates no cut on September 30, but a circa 75% chance of a cut on 4 November. The relative economic performance of Australia versus New Zealand is also a key component. With some slow improvements beginning to show in China’s economy, particularly the manufacturing sector, the Aussie dollar is likely to benefit more than the Kiwi on this front. Risks are skewed towards a lower NZDAUD cross.
Kiwi crosses in the months ahead
Hamish Wilkinson – Senior Dealer, Financial Markets
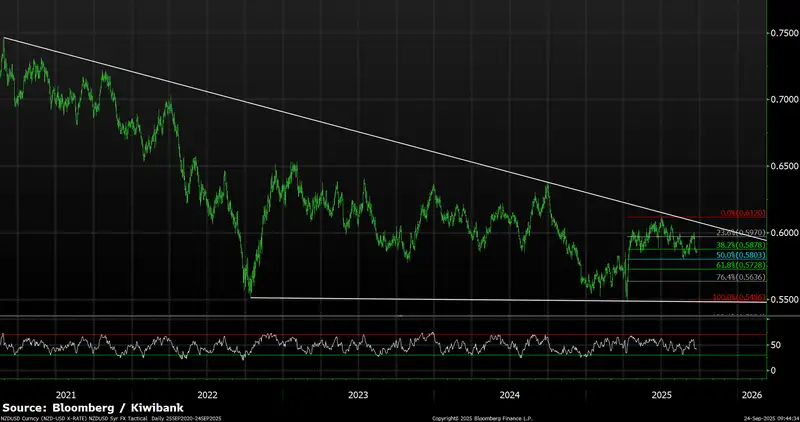
NZDUSD (5-year weekly)
The Kiwi remains caught between two powerful crosscurrents as we head into Q4 2025. On one side, the RBNZ’s aggressive pivot and the sharply negative Q2 GDP print have seen market pricing shift rapidly toward a much lower OCR by year-end. This has capped NZD upside and weighed on sentiment, especially as the RBNZ is now expected to ease policy more quickly than most developed market peers—most notably in the Kiwi crosses. On the other side, the Fed’s resumption of its easing cycle, with a further 50bp of cuts expected by Christmas and a more gradual path into 2026, has helped to stabilise risk appetite and limit USD strength. Over the past quarter, the Kiwi failed to break multi-year downtrend resistance at 0.6150, as anticipated. The rally stalled just below this level, and subsequent price action has been capped at 0.6120, with the pair now consolidating below 0.60. The downside target of 0.5860 was achieved, with the 61.8% retracement level moving up to 0.5728 but not yet reached, reflecting the resilience of the broader technical structure. The call to “sell USD on dips” has been effective during the period. The technical setup remains familiar, with the triangle structure and multi-year resistance still in play. While the NZD remains vulnerable to further domestic data disappointments and external shocks, given the Fed’s easing stance, the risk of a decisive break below the multi-year 0.55 support has receded for now. Technically, the 50% retracement at 0.5803 and the 61.8% retracement at 0.5728 have emerged as critical support levels, closely aligning with the lower boundary of the current trading range. The upside trend resistance, now at 0.6080/0.61, acts as a key resistance, capping rallies and reinforcing the importance of the broader triangle structure
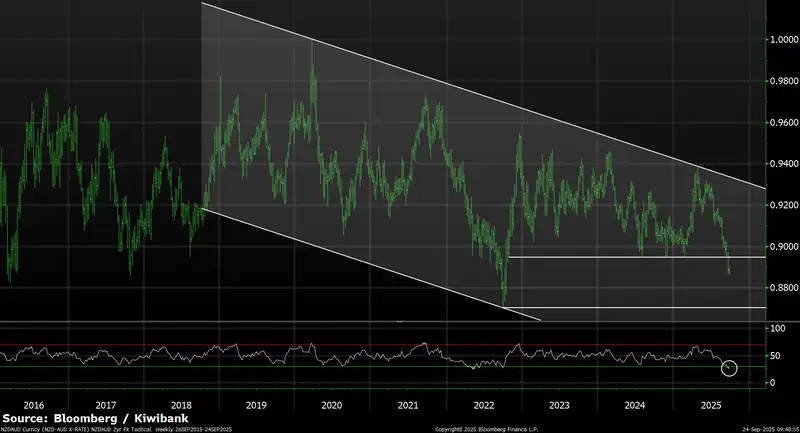
NZDAUD (10-year weekly)
In a world where monetary pivots set the tone, the RBNZ’s sharp dovish turn has reset the NZD/AUD landscape - with the OCR expected near 2.25% by Christmas after a weak Q2 GDP (-0.9%) — momentum firmly flipped against the NZD. In contrast, the RBA’s cautious approach to rate cuts leaves relative policy settings skewed in favour of the AUD. Technicals confirm the shift: the break below 0.8950 re-engages the multi-year downtrend. Support: 0.8840/50, then 0.8700 (2022 low). Resistance: 0.8950, 0.9050 and potentially above 0.9200. RSI signals oversold, warning of corrective rallies, but bias remains lower. Outlook: With fundamentals and charts aligned, NZD/AUD looks set to grind lower, targeting 0.8800 near term, with scope for 0.8700 if NZ data continues to underperform.
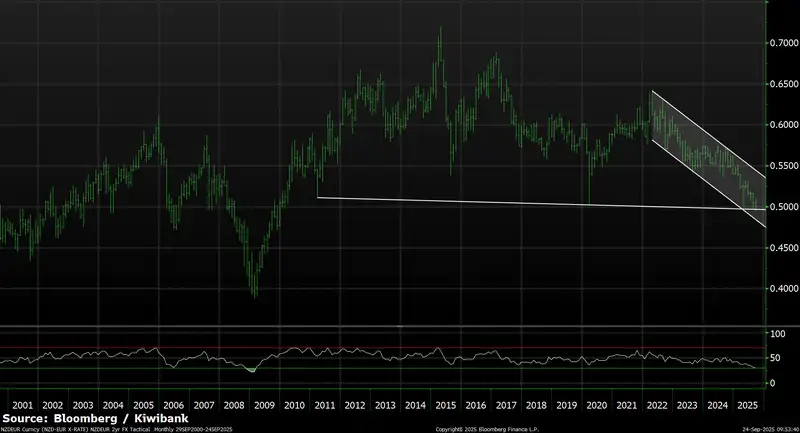
NZDEUR (25-year weekly)
NZD/EUR is flirting with history as it tests multi-decade support, with the cross teetering on the edge of uncharted territory. Given the expected RBNZ trajectory and a late ECB’s easing cycle which is now largely priced in, the Kiwi’s positive carry against the EUR is eroding. This keeps the bias lower for NZD/EUR, with the risk of a retest of the major multi-decade support at 0.4950 – 0.5000. A sustained break below 0.4950/70 would mark new multi-decade lows, opening the doors to levels not seen since GFC lows and potentially accelerating downside momentum. However, oversold conditions and proximity to this major support warn of corrective rallies. On the upside, initial resistance is seen at 0.5060, followed by 0.5150 and 0.5180. These levels are likely to cap any rebounds unless there is a significant shift in the fundamental backdrop. For now, the technical and fundamental picture remains aligned to the downside, but traders should be alert to the potential for sharp corrective moves if support holds or if the ECB surprises with a more dovish stance.
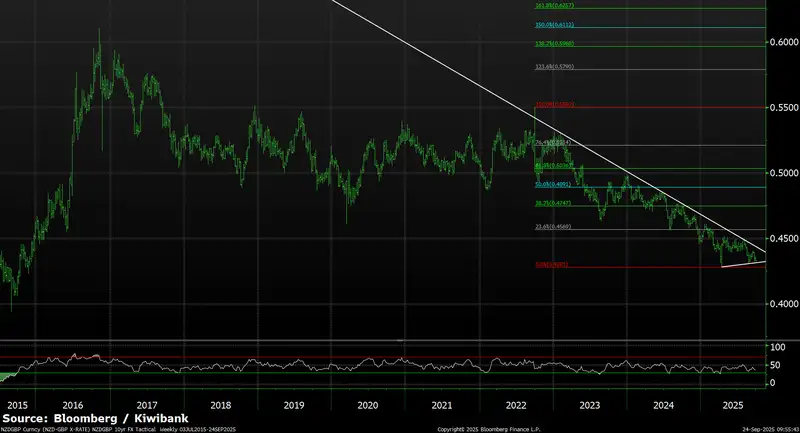
NZDGBP (10-year weekly)
While NZD/GBP remains near multi-year lows, the story is no longer one-way. The UK’s persistent inflation and the Bank of England’s cautious stance on further rate easing (BOE Rate = 4%) have kept GBP supported, but recent fiscal challenges are starting to weigh on sentiment. Rising government borrowing, widening deficits, and a sharp move higher in gilt yields have revived concerns about “gilt vigilantes”—investors demanding higher returns to hold UK government debt. This has injected fresh volatility into GBP and raised the risk of a more pronounced correction if fiscal credibility comes into question. Technically, NZD/GBP continues to trade in a well-defined downtrend, with the cross consolidating near the lower end of a converging triangle pattern. Whilst the short term “higher lows” at 0.4307 and 0.4320 will provide support from the converging triangle picture, the 0.4280 level remains key support. On the flip side, rallies are capped below the broader downtrend channel currently at 0.4450. If UK fiscal / Gilt vigilante risks escalate, a corrective rebound beyond channel resistance is possible - but the broader bias remains lower at this point. Watch for further downside toward the 2015 low of 0.3941 if NZD weakness persists.
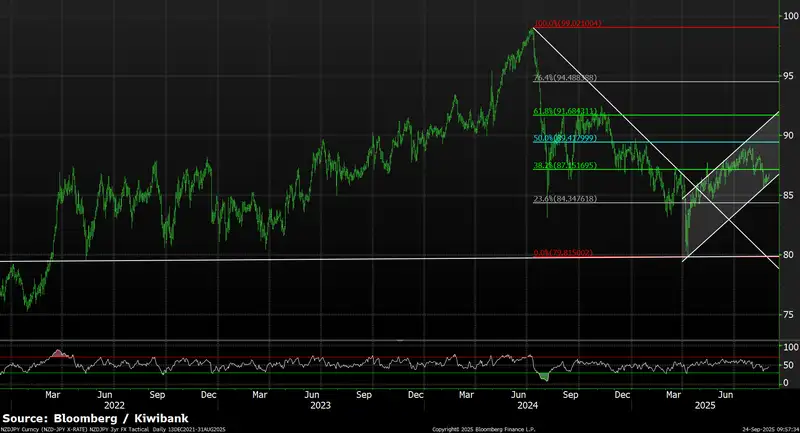
NZDJPY (3-year daily)
From theory to turbulence – NZD/JPY remains volatile as Japan’s policy shift collides with New Zealand’s economic reset. Over recent quarters, our bearish NZD/JPY view played out as expected, with the cross hitting a low of 79.82 in Q2, driven by narrowing rate differentials and safe-haven JPY demand. However, those losses were short-lived. As markets began to question the sustainability of higher Japanese interest rates—amid rising JGB issuance and the risk of BOJ intervention—JPY strength faded, and NZD/JPY rebounded sharply, reaching a high of 89.06 last quarter. While the long-term JPY story remains intact—anchored by a slow and complex policy normalisation—the near-term path is far from linear. Japan’s fiscal balancing act and concerns around BOJ credibility continue to cap JPY strength. Meanwhile, New Zealand’s weakening macro backdrop and the RBNZ’s aggressive easing bias keep the NZD under pressure. We expect NZD/JPY to remain volatile within a broad range, with rallies likely to fade below 91.60 and downside risks re-emerging on any renewed JPY strength or further NZ data disappointments. Interestingly, from a technical perspective, an emerging reverse head and shoulders pattern supports the possibility of a full retracement toward 91.68 beyond the initial upside target of 89.42. However, that scenario may depend on upside surprises in New Zealand economic data—something that could materialise as stimulatory monetary policy settings begin to take effect.
Glossary
Commodity currencies: include the Kiwi dollar, Aussie dollar, Canadian dollar, Norwegian krone as well as currencies of some developing nations like the Brazilian real. These countries export large amounts of commodities (raw materials like oil, metals and dairy) to the world. And commodity currencies are highly correlated with the global prices of such commodities. When the global economy is strong and demand for commodities is high, commodity prices and thus commodity currencies, tend to outperform. The Aussie and Kiwi dollars are famously known for the sensitivity to good news (risk on) and bad news (risk off).
Interest rate differentials: The difference between the interest rates earnt on two different currencies. New Zealand may offer a significantly higher interest rate than those in Japan, for example, and we see an inflow of Yen into Kiwi dollars (known as the “carry trade”). The widening, and narrowing, of interest rate differentials can have a material impact on capital flows and therefore the exchange rate.
Monetary hawk (hawkish) and Monetary dove (dovish): Characterisations of central bank monetary policy. The hawk is a bird of prey and describes a central bank aggressively raising interest rates to slow economic growth and tame the inflation beast. The peace-loving dove however, reflects a central bank trying to stimulate economic growth by cutting interest rates.
Moving averages: A common method used in technical analysis to smooth out price data by showing the average over various time periods.
Relative Strength Index (RSI): is a popular momentum indicator used by forex traders to measure the speed and change of movements in currencies. It is a useful tool to evaluate overbought or oversold market conditions, in turn signalling whether a currency pair is due a trend reversal or a corrective pullback in price. Low RSI levels indicate oversold conditions (buy signal), while high RSI levels indicate overbought conditions (sell signal).
Reserve currency: The US dollar is the global reserve currency. The dominance of the US dollar in international trade means most central banks and financial institutions hold large amounts. The majority of FX reserves are held in US dollars. The US currency and debt markets are the most liquid in the world. And liquidity (the ability to buy and sell, especially in times of stress) is important. The next most traded currency is the Euro, but it is nowhere near as popular as the US dollar. About 60% of global reserves are held in dollars, with the Euro attracting only 20%, according to the IMF.
Safe haven currencies: A safe haven currency is one where investors hide from extreme market turbulence. The US dollar tops the list of safe haven currencies. But the Yen and Swiss Franc are also beneficiaries of save haven flows (money searching for safety). If a war breaks out tomorrow, we’re likely to see a spike in the USD, Yen, and Swiss Franc. The Kiwi dollar would be hit quite hard, and fall against these three currencies. Gold is also considered to be a safe haven asset during times of stress.
Support and Resistance levels: These are chart levels that appear to limit a currency’s price movement. A support level limits moves to the downside; a resistance level limits moves to the upside.
Terms of trade: The ratio of the prices at which a country sells its exports to the prices it pays for its imports. Put simply, terms of trade is a measure of a country’s purchasing power with the rest of the world. How many imports can be purchased per unit of exports – import bang per export buck. An increase in our terms of trade means New Zealand can purchase more import goods for the same quantity of exports. And a rising terms of trade lifts the incomes of exporters and the businesses and communities that support them.
All content is general commentary, research and information only and isn’t financial or investment advice. This information doesn’t take into account your objectives, financial situation or needs, and its contents shouldn’t be relied on or used as a basis for entering into any products described in it. The views expressed are those of the authors and are based on information reasonably believed but not warranted to be or remain correct. Any views or information, while given in good faith, aren’t necessarily the views of Kiwibank Limited and are given with an express disclaimer of responsibility. Except where contrary to law, Kiwibank and its related entities aren’t liable for the information and no right of action shall arise or can be taken against any of the authors, Kiwibank Limited or its employees either directly or indirectly as a result of any views expressed from this information.