

- We’re fixated on the Middle East. The supply shock is pushing price pressure onto businesses and households already hurting. It’s the impact on demand that has us on edge. The price increase is one thing, a fuel shortage is another. And our economy is weaker than expected at this stage in the recovery. Demand destruction is unfolding.
- The new RBNZ Governor has been called upon, for the third time in as many months, to cool things down. And Anna Breman continues to play her role well. Although it’s difficult when markets dry up, banks get faced the same way, and hedge funds vanish.
- As always, risks are abound. Rate hikes are priced in too early. The tightening in market conditions has gone too far. And the RBNZ agree. The Kiwi dollar may face some short-term weakness as market pricing recalibrates. And we might get a more dramatic move south, if the conflict escalates.
We started the year with rate hike expectations already priced in. And such elevated expectations were premature. But they persist. The dramatic disruption and uncertainty surrounding the Middle East conflict is creating immediate inflation pressures. In response, traders have doubled down and factored in even more rate hikes, coming earlier in 2026. But it is the demand destruction that’s missing from interest rate market sentiment. We say it again, rate market pricing is “way too aggressive and premature."
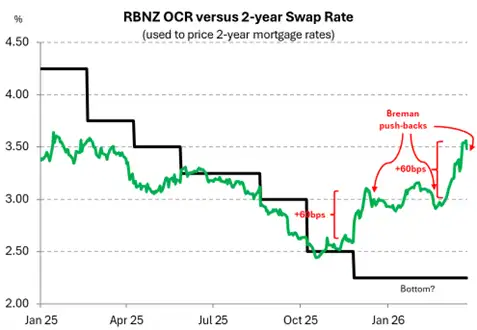
It’s worth pointing out the illiquidity in Kiwi rates markets. Much of the move in wholesale rates has been flow driven. That means banks are facing the same way, needing to pay swap rates, and are unable to find receivers (typically hedge funds) on the other side. Hedge funds are conspicuously absent. Hence, rates have gapped higher.
It will take time, but the fundamentals will eventually override the squeeze. And rates should fall back in line with more rational expectations. The risks to domestic and global demand are heavily weighted to the downside. And the RBNZ understand the risks, all too well.
Our new RBNZ Governor, Anna Breman is encouraging us to keep ice in our bellies, and keep cool, calm and don’t overreact – at least that’s what the RBNZ will do. With wholesale rates pricing in three rate hikes this year (down from almost 4), we think the market has a long way to go. There’s money on the table for traders willing to watch the RBNZ pause until they assess the damage. And that will take time. The war needs to end, and oil prices need to normalise. Something that may take many months.
Our view is that the increased uncertainty and high fuel costs flowing through the economy will cause households and businesses to pull back on spending. We could record another contraction in activity over the second quarter, before we have a chance to recover later in the year. It feels like 2025 all over again. The rise in the cost of petrol will cause inflation to rise, yes, but it’s already hitting wallets much harder. We came into the year expecting inflation to fall, starting in the low 3s. Now we are expecting inflation to stay at low 3s into the end of the year. This is no post-covid (7%) inflation boom. Demand is much softer now.
Just getting to work, and keeping the lights on, will be top of mind for many Kiwi households already weighed down by cost-of-living pressures. With a high unemployment rate (5.4%) and only 2% jobs growth in the last quarter, workers have very little bargaining power to increase their wages. So we don’t expect a wage-price spiral.
Given the risks, we think markets are overpriced, pricing in rate hikes that have a low chance of materialising. We are more likely to see businesses struggling to pass on higher operating costs to already cash-strapped consumers. And we are likely to see a crunching blow to our tourism industry. Both tourism and agriculture are sensitive to fuel price hikes and global trade disruptions. Our other goods exports may also face transport challenges.
Every hour a new headline from Trump speaks to ending the war, peace negotiations and total victory. While news of troops being deployed, more bombs being dropped and conflict escalating peppers the news cycle in-between. There’s been a lot for markets to react to. And yet the VIX index, which measures market volatility, aka market panic, hasn’t gotten anywhere near the levels we saw during covid, Russia’s attack on Ukraine, or liberation day (at least not yet).
We thought we would see more action from the Kiwi flyer (NZDUSD). We had a bumpy start to 2026, with a spread in the year to date of 4 cents (low 0.57 – hi 0.61). NZD was tracking up. We saw a move from a 0.58c year open to a 0.61c peak at the end of January, and we stayed hovering in that range until late February. Just like last year’s Liberation Day tariffs, the Iran conflict and subsequent disruptions to global oil supply served the Kiwi a blow. Oil trades in USD per barrel, so the weaker our Kiwi flyer is, the less oil we can buy with the same dollar. A weak NZD/USD exchange rate increases the cost of oil even further for the Kiwi economy, exacerbating the spikes in oil prices, peaking at $119USD for brent crude so far. This is nowhere near market records or the peak we saw at the beginning of the Russia-Ukraine invasion of $139USD per barrel. We don’t expect we’ve hit the peak in this crisis yet, and if the conflict is protracted, we could see new records being set. For now, all we can do is anxiously wait and see.
We’re seeing another interesting reaction (or lack thereof) in the NZD/AUD. It’s the lowest it’s been since June 2013, (0.82c). This is good news, at least in the short term, as Australia is a big export market for us, and for them NZ just became Briscoes, chronically on sale. With the Aussie economy still heating up according to the RBA, hopefully they can give us a boost on the way up.
Anything short of a quick resolution, a peace deal of sorts, could see the Kiwi falling further. That’s the dominant risk, in our view. A move into the mid-50s seems fair. At 58c today, we see a move back towards 56-57c as likely, given the crisis. 55c seems to be good resistance. But panicked selling into the low 50s, although unlikely at this stage, is not out of the realms of possibility. We would be surprised to see a move back into the 60s. Although that would represent good news.
Trading view, what’s next?
Mieneke Perniskie – Senior Dealer, Financial Markets
So far 2026 has been a year of escalation in geopolitical risks. And just as we are due to deliver our quarterly FX tactical, the beginning of March makes no exception. Trying to predict direction in currency, or indeed anything in the current environment is always going to be a bit of a stab in the dark. At our last tactical, we were looking forward into 2026 and predicting that the Kiwi dollar should get some wings as we look to step into a year of slow but sure economic recovery. Our view for the Kiwi dollar was that we would be heading towards the 0.6000/0.6100 levels towards the end of 2026, with perhaps a few speedbumps along the way. We did have a caveat on the strength of the Kiwi being tied to our relative economic performance… at the December point, we had an RBNZ that was looking to normalise monetary policy settings away from the stimulatory levels that they’ve been providing, but likely not until late 2026/early 2027 at the earliest. They were more likely to keep the OCR at current levels to ensure our recovery was sticky in early 2026. The high frequency data points were Kiwi dollar supportive, and we continued to see improvements in these indicators through January and February, albeit at a slower pace. Where we are sitting now, these facts remain in play. But the big fly in the ointment is the Iran war. This now posits a very real threat to the global economy, with inflation concerns rising, and perhaps of even more concern the potential to derail the fragile global economy before it had fully recovered from the last doldrums. The Kiwi economy really doesn’t need this. The key for market participants at present, is very much how long the war between US/Israel and Iran will continue. And that is anyone’s guess at this point. With thoroughly confusing rhetoric out of the White House, markets are currently seesawing between one extreme and another, day to day.
While the wholesale rates market has seen some of the more extreme volatility as traders price in inflation pressures, currency markets have been relatively calm. In part this is due to the unified pressure on rates globally. At present, currencies are moving in step as the US dollar catches a bid as a risk haven. This has meant the Kiwi dollar remains quite well anchored in the 0.5800/0.5900 levels, with only brief dips into the high 0.5700s. In a best-case scenario, were we to see a quick resolution to the conflict, the Kiwi dollar should return to more of a good news story, back to the 0.5900/0.5950 support with the view to track higher into the 0.6000 level in the medium term. These moves if they came to fruition, would represent ‘normalisation’ in global risk appetite. The US Dollar story would also see a return of gradual easing views in regard to the Federal reserve, which would in time also be Kiwi dollar supportive.
However. These are all big ‘if’ statements. At the current moment, we are at a precipice. If the Iran situation drags on we think it more likely than not that the Kiwi dollar will head back towards the 0.5500 levels, which were the lower levels of the Kiwi that we saw during the initial onslaught of the ‘Great Tariff Tiff’ almost a year ago. What could be somewhat supportive of the Kiwi, is that globally a dragging out of war impacts everyone (but not necessarily equally). The US dollar would represent more of a safety haven, at least initially. Rate differentials would likely become more nuanced and eventually move into later tenors of the rates curve (war is expensive and terrible for risk sentiment). But there would be little to support the Kiwi from a growth perspective, and 0.6000 would be off the table.
For now, as we all hope for rapid de-escalation, buying Kiwi on the dips is still the key play on the export side, given that our longer-term view on the Kiwi is unchanged… for now. Importers should consider entering in the 0.5900/0.5950 levels in the short term, where we see partial improvements in risk sentiment. Understandably further caution on all activity is going to become more prominent as time moves on and we don’t see an end point in sight.
Now to the other major Kiwi cross…the NZDAUD. This has had an interesting year to date, to say the least. At our last tactical, the cross was trading around 0.8700. We did warn of downward risks, particularly if the RBA took a more hawkish tone…and they certainly did. The Kiwi has crashed through the 0.8600, 0.8400 and 0.8300 levels recently, but seems to have found a current lower base of 0.8250, and is looking relatively comfortable at 0.8350. The hawkish rhetoric from the RBA late last year, turned out to be more than words, and they have delivered 2 hikes. The rate differential view has seen the NZDAUD cross break firmly into the lower levels, already mentioned. The RBA are expected to continue with further rate hikes across the year. The inflation outlook for now, certainly supports the view that the RBA will continue to tighten monetary policy, and fundamentally the Aussie economy is better positioned to absorb more of the expected global shocks. The Aussie CPI print this week was slightly softer than anticipated, and this has perhaps provided a little firmer footing for the NZDAUD cross for now, taking a little of the heat out of RBA hike expectations. From a technical and positioning perspective, we do note that the huge move lower in the cross is potentially overdone. And the Kiwi rates market still has plenty of hot air in it, driven by global moves. In the meantime, we expect the NZDAUD cross may hold current levels, but for how long is the question. For the time being, a return to 0.8500 seems unlikely.
Kiwi crosses in the months ahead
Hamish Wilkinson – Senior Dealer, Financial Markets
Despite geo-political uncertainty, in the last quarter, the NZ Dollar has changed its longer-term technical outlook. The path from here however is defined by hope and fear…
NZDUSD (1 year, daily) — Base intact, but geopolitics capping momentum
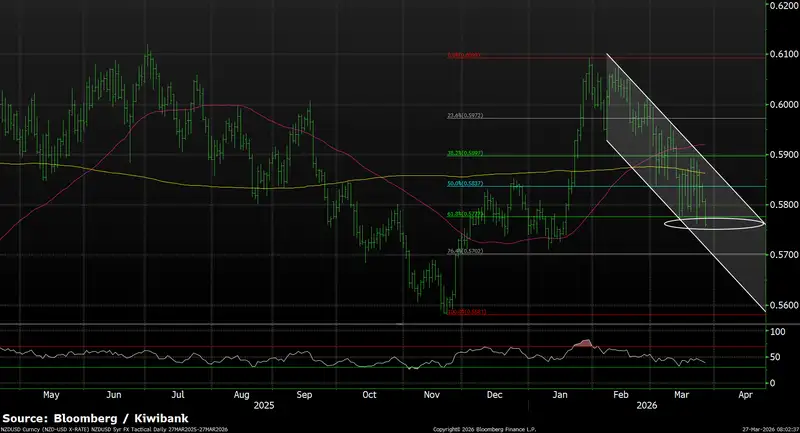
NZD/USD has confirmed a medium term base following the November 2025 lows near 0.5580, rallying sharply into January highs just below 0.6100 as markets moved to price the end of the RBNZ’s easing cycle. That move validated the broader bottoming thesis, but upside progress has since stalled.
Escalating geopolitical risk — particularly the Iran conflict — has lifted inflation uncertainty and driven renewed USD safe haven demand, keeping high beta currencies like the Kiwi range bound. Unlike rates markets, FX volatility has remained contained, with NZD/USD largely anchored between 0.5800 and 0.5900. Technically, price is consolidating within a well defined corrective channel, suggesting digestion rather than trend failure. Heavy resistance remains layered through 0.6000–0.6100, while the near term pivot sits at 0.5870–0.5900. A sustained break above this zone would reopen the path toward 0.6000, particularly if geopolitical risks ease and Fed easing expectations re-emerge. Conversely, a break below 0.5770 would expose downside toward 0.57-0.5720, and potentially 0.5500 should risk sentiment deteriorate further.
Momentum has cooled from overbought levels without tipping bearish, reinforcing the view that the Kiwi is pausing, not rolling over. The November low remains a key structural floor, but near term direction will continue to be dictated by headlines rather than fundamentals.
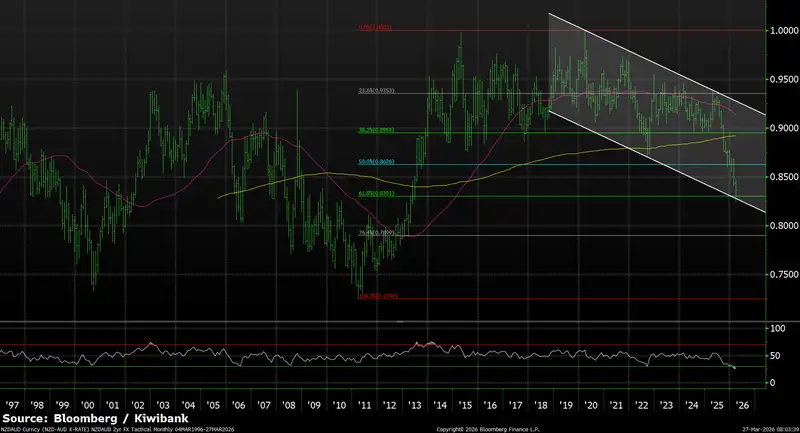
NZDAUD (long term/monthly context) — At major fib support, but trend pressure remains
NZD/AUD has now traded into the 61.8% Fibonacci retracement on the long term (monthly) chart, a structurally significant zone that often marks the line between trend continuation and consolidation. After collapsing from the 0.87–0.88 region and slicing cleanly through successive support levels, the cross has, for now, found footing around this broader fib level and appears to be holding — at least temporarily.
The macro drivers remain familiar. The RBA’s hawkish follow through and Australia’s relatively stronger growth resilience continue to underpin AUD outperformance, while the RBNZ remains focused on protecting a fragile domestic recovery. In a global backdrop dominated by geopolitical risk and inflation uncertainty, rate differentials and relative economic durability still favour Australia — keeping downward pressure on the cross. That said, from a technical perspective the asymmetry is less compelling at these levels. The speed and depth of the move lower mean a substantial amount of bad news is now priced, and the cross is sitting at a zone where historically selling momentum tends to fatigue. Any rebound from here should be viewed as corrective rather than trend changing, with former supports higher up now firm resistance. A sustained break below this fib region would reopen downside risk and confirm the broader descending channel remains firmly in control. Conversely, as long as this level holds, near term consolidation or shallow retracements higher look more plausible than another immediate leg lower.
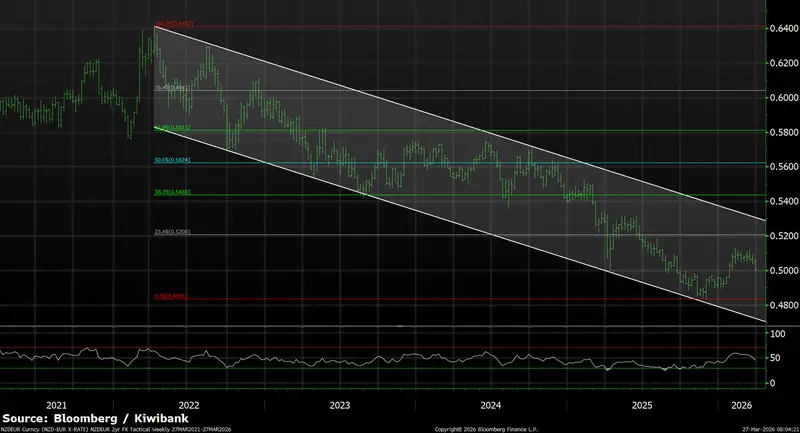
NZDEUR (5 year, weekly) — Corrective rally, but downside channel range still rules
NZD/EUR has staged a corrective move higher within its broader descending channel, lifting toward the 0.5150 region (0.5128 recent high) after holding support near the lower channel boundary in late 2025. This rebound reflects short term momentum rather than any change in the underlying trend, with the longer term structure still pointing lower. From a macro standpoint, the ECB remains firmly focused on inflation outcomes, but much like its global peers, has shown little willingness to pivot prematurely as of this point. That policy stance continues to provide underlying support for EUR and limits the scope for sustained NZD outperformance, particularly given New Zealand’s sensitivity to global growth and risk sentiment. As a result, rallies in NZD/EUR continue to look corrective and fragile, rather than the start of a trend reversal.
Technically, resistance into the 0.5150–0.5200 zone is expected to cap upside in the near term, while support is well defined around 0.4830. For the quarter ahead, 0.4830–0.5200 remains the favoured trading range, with the cross likely to oscillate rather than break meaningfully in either direction unless there is a material shift in ECB policy signals or global risk dynamics.
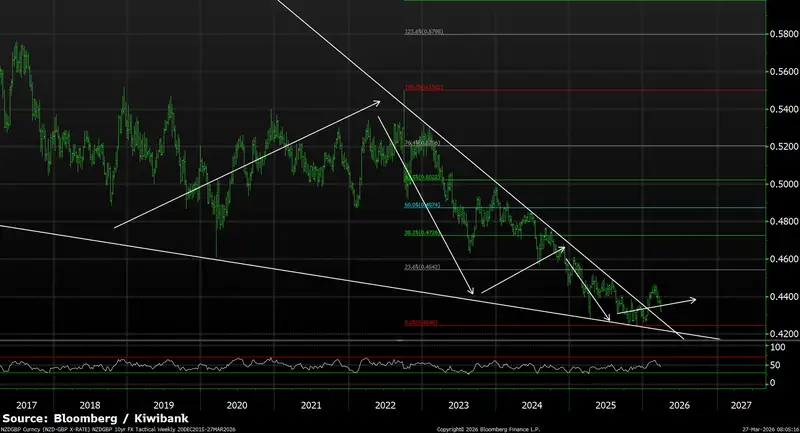
NZDGBP (10 year, daily) — Anticipated wedge reversal delivers
NZD/GBP has now confirmed the falling wedge reversal anticipated in December, decisively breaking above the upper boundary of its multi-year downtrend. The move validates the earlier constructive technical setup, with trend resistance around 0.4330 cleared and now transitioning into support — this was a signposted reversal, not an accident, signalling a meaningful shift in the longer term structure. The macro backdrop has aligned with the chart. Persistent inflation pressures and fiscal uncertainty in the UK have limited the Bank of England’s room to ease decisively, while the RBNZ’s more neutral stance has helped to start underpin the NZD, allowing the cross to finally escape a trend that had capped rallies for several years. From here, price action above the former resistance zone is key. As long as NZD/GBP holds above the breakout area, the bias remains toward consolidation and extension higher rather than a return to the old channel, with upside risk skewed initially toward the mid 0.45s and beyond. On the downside, a revisit and clearing of 0.4220/40 would be needed to reopen a bearish outlook.
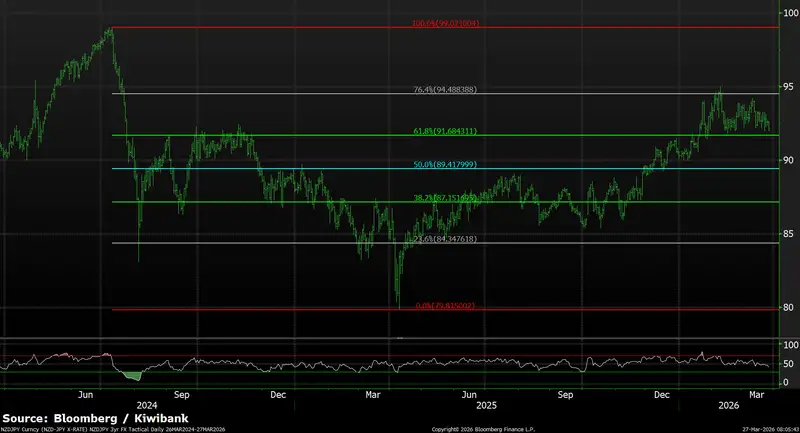
NZDJPY (Quarter ahead view, 2 year daily) — Constructive, but consolidation favoured
(Quarter ahead view, 2 year daily) — Constructive, but consolidation favoured
The inverse head and shoulders breakout anticipated in December has played out, with NZD/JPY clearing the 89.00 neckline and pushing onwards to 91.60. Since then, momentum has cooled, and the cross is consolidating below the 93–95 resistance zone, where retracement levels are holding interim support and resistance. Looking ahead, the macro backdrop remains supportive but conflicted. The BOJ continues to talk up policy normalisation, but this sits uncomfortably alongside a fiscally expansive stance from Japan’s new Prime Minister, Sanae Takaichi and a gradually more dovish composition on the BOJ board, both of which argue for a slower, less forceful tightening path. This policy tension has kept JPY structurally weak as markets digest a higher rates environment mixed with fiscal uncertainty for bond holders. For the quarter ahead, dips toward 90–91 should remain supported, while sustained gains require a clear break above 95 to reopen upside towards 2024 high.
Glossary
Commodity currencies: include the Kiwi dollar, Aussie dollar, Canadian dollar, Norwegian krone as well as currencies of some developing nations like the Brazilian real. These countries export large amounts of commodities (raw materials like oil, metals and dairy) to the world. And commodity currencies are highly correlated with the global prices of such commodities. When the global economy is strong and demand for commodities is high, commodity prices and thus commodity currencies, tend to outperform. The Aussie and Kiwi dollars are famously known for the sensitivity to good news (risk on) and bad news (risk off).
Interest rate differentials: The difference between the interest rates earnt on two different currencies. New Zealand may offer a significantly higher interest rate than those in Japan, for example, and we see an inflow of Yen into Kiwi dollars (known as the “carry trade”). The widening, and narrowing, of interest rate differentials can have a material impact on capital flows and therefore the exchange rate.
Monetary hawk (hawkish) and Monetary dove (dovish): Characterisations of central bank monetary policy. The hawk is a bird of prey and describes a central bank aggressively raising interest rates to slow economic growth and tame the inflation beast. The peace-loving dove however, reflects a central bank trying to stimulate economic growth by cutting interest rates.
Moving averages: A common method used in technical analysis to smooth out price data by showing the average over various time periods.
Relative Strength Index (RSI): is a popular momentum indicator used by forex traders to measure the speed and change of movements in currencies. It is a useful tool to evaluate overbought or oversold market conditions, in turn signalling whether a currency pair is due a trend reversal or a corrective pullback in price. Low RSI levels indicate oversold conditions (buy signal), while high RSI levels indicate overbought conditions (sell signal).
Reserve currency: The US dollar is the global reserve currency. The dominance of the US dollar in international trade means most central banks and financial institutions hold large amounts. The majority of FX reserves are held in US dollars. The US currency and debt markets are the most liquid in the world. And liquidity (the ability to buy and sell, especially in times of stress) is important. The next most traded currency is the Euro, but it is nowhere near as popular as the US dollar. About 60% of global reserves are held in dollars, with the Euro attracting only 20%, according to the IMF.
Safe haven currencies: A safe haven currency is one where investors hide from extreme market turbulence. The US dollar tops the list of safe haven currencies. But the Yen and Swiss Franc are also beneficiaries of save haven flows (money searching for safety). If a war breaks out tomorrow, we’re likely to see a spike in the USD, Yen, and Swiss Franc. The Kiwi dollar would be hit quite hard, and fall against these three currencies. Gold is also considered to be a safe haven asset during times of stress.
Support and Resistance levels: These are chart levels that appear to limit a currency’s price movement. A support level limits moves to the downside; a resistance level limits moves to the upside.
Terms of trade: The ratio of the prices at which a country sells its exports to the prices it pays for its imports. Put simply, terms of trade is a measure of a country’s purchasing power with the rest of the world. How many imports can be purchased per unit of exports – import bang per export buck. An increase in our terms of trade means New Zealand can purchase more import goods for the same quantity of exports. And a rising terms of trade lifts the incomes of exporters and the businesses and communities that support them.
All content is general commentary, research and information only and isn’t financial or investment advice. This information doesn’t take into account your objectives, financial situation or needs, and its contents shouldn’t be relied on or used as a basis for entering into any products described in it. The views expressed are those of the authors and are based on information reasonably believed but not warranted to be or remain correct. Any views or information, while given in good faith, aren’t necessarily the views of Kiwibank Limited and are given with an express disclaimer of responsibility. Except where contrary to law, Kiwibank and its related entities aren’t liable for the information and no right of action shall arise or can be taken against any of the authors, Kiwibank Limited or its employees either directly or indirectly as a result of any views expressed from this information.