

- All eyes were on the US jobs market report last week. It received a bit more attention following last month’s claims by Trump that the data were “rigged” and “wrong”. And he fired the Bureau Commissioner. Well, it was weak, again. Although the July figures were revised up, funnily enough, the others were revised down, and the headline print for August was soft. So, who does he fire now?
- The weak US economy supports calls for lower US interest rates. And they will come. Just as further rate cuts elsewhere, and here, will come. Although the Aussie’s are not as convinced. Consumer spending is already picking up with limited rate cuts to date. It is the lucky country.
- Our Chart of the Week looks at construction activity over the June quarter. With the housing market still depressed and interest rates not yet at enticing levels, construction activity continues to decline. Though lower rates on the horizon and a warmer housing market into spring should help the industry find its feet again.
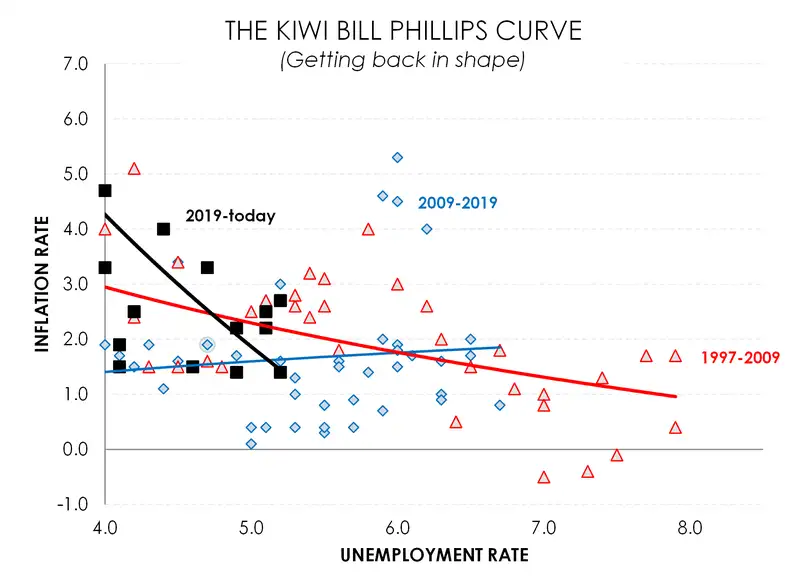
It's all about the Phillips curve. Famous Kiwi economist Bill Phillips put it best. There’s a relationship between rising unemployment, and inflation. And unemployment rates are rising. Market traders waited eagerly last week for the latest US non-farm payrolls report, for August. July’s shockingly weak print led Trump to fire the Chief of the Labor Statistics Bureau… Trump claimed the data were “rigged” as they reflected poorly on his administration. By no surprise, new head of labour statistics or not, August’s data offered no reprieve. The US labour market is weakening.
Following July’s weakness, the bar for jobs growth was set low with just 75k jobs expected in August. And even that proved too high. Only 22,000 jobs were added. And revisions to prior months showed the US labour market was weaker than previously thought. July’s “rigged” figures were revised up slightly by 6,000 jobs to a still weak 79k. But June’s data were revised down sharply, showing a net loss of 13,000 jobs… the first monthly decline since 2020.
The US unemployment rate rose to 4.3% - the highest level since 2021. Hiring has stalled, and spare capacity is building. And the slack is already feeding through to wages, which are cooling faster than expected. Average hourly earnings grew just 3.7% over the year, down from 3.9%, undershooting forecasts and reinforcing the narrative of a softening labour market.
Overall, the weak payrolls report solidified expectations for a 25bps rate cut from the Fed next week. Markets had priced in a 75–80% chance of a cut before the payrolls release, which has now moved to be fully priced. And there’s even a small probability being priced in for a larger 50bps cut. However, higher producer and consumer price inflation data out this week is expected to cool talks of a 50bps rate cut.
Closer to home, the Australian economy grew 0.6% over the June quarter, after a slow start to the year. The Aussie economy is 1.8% bigger over the year. A 0.9% increase in consumer spending underpinned the rebound. It was the strongest increase since late 2022. For a while, households have held back spending in a cost-of-living crisis. But with the RBA’s cutting cycle and falling inflation, real disposable incomes are growing and encouraging spending. The usual holidays like ANZAC Day and Easter, as well as better weather conditions helped boost activity. Other key expenditure components, however, remain subdued. Business investment declined in the quarter with capex intentions suggesting the softness will continue.
Following the data, RBA Governor Michelle Bullock cautioned future rate cuts. If consumer spending continues to rise rapidly, then “there may not be many interest rate declines yet to come. But it depends”. The market trimmed the amount of easing to 21bps by November, compared to around 26bps ahead of the data. In the land of currency, the Kiwi Aussie cross (NZDAUD) continued on its glide path lower. The Kiwi Aussie cross (NZDAUD) continued to glide lower, hitting a low of 89.69.
At home it’s been a bit quieter with just some partial GDP data out over the week. Building activity, intrinsically tied to the housing market, remained weak over the June quarter (see our Chart of the Week for more). But on a brighter note, despite the mass uncertainty and waves of tariff announcements over the June quarter, our trade sector has held up well. Total exports fell just over 2% in the June quarter compared to March, though March was an exceptionally strong base. And over the year, our Kiwi exports are still up 10%. Even better, our terms of trade rose 4.1% over the quarter—more than double the consensus forecast of 1.9%. Export prices for goods edged up 0.2%, while import prices fell 3.7%,
Financial Markets
The comments below were provided by Kiwibank traders. Trader comments may not reflect the view of the research team.
In rates, direction was lacking
“Rates lacked clear direction last week, oscillating amid renewed concerns over the global fiscal outlook. This time, investor confidence in the UK’s fiscal stance came under pressure, pushing 30-year gilt yields to their highest level since 1998. That theme isn’t isolated as US curve dynamics echo similar sentiment, with the 2y-30y spread steepening by approximately +100bp over the past year!
The US non-farm payrolls report supported market expectations for Fed rate cuts. A modest probability of a -50bp cut is now priced in for September, with a total of -27bp implied. Across the next three meetings (before year-end) markets are pricing in -69bp of cuts, up from -59bp prior to the employment data. However, concerns around the potential impact of tariffs, limited immigration and an aging workforce may limit the FED’s appetite to cut aggressively.
Domestically, RBNZ rate expectations remain a key focus. Markets are currently pricing in a -22bp cut for October and -39bp by November, with a total of -47bp priced in by May 2026. So why hasn’t a full -50bp been priced in earlier? Several factors are contributing to this hesitation: uncertainty around easing beyond the neutral rate, signs that the cycle may be nearing its end, mortgage refixing dynamics, and the upcoming appointment of a new RBNZ Governor, among others.
Domestically, curve shape is the key theme. More cuts now are being interpreted as more hikes later. Combined with global fiscal concerns, this is pushing long-end yields higher and steepening curves. The NZ 2y-10y swap spread has widened by around +13bp over the past month, now sitting above +100bp. The 2-year part of the curve remains relatively anchored by monetary policy expectations.” Ross Weston, Head of Balance Sheet Management – Treasury.
In currencies, the Kiwi sticks to recent ranges as we wait for the Fed
Last week the Kiwi dollar traded in familiar ranges against the US dollar, but movements still reflected the tone of market sentiment. After opening the week near 0.5900, the Kiwi tracked lower to 0.5840 on the back of poor risk sentiment, as concerns around fiscal spending hit bond markets again, driven by UK gilts but extending across to US treasuries. This theme is likely to come into play again in the coming weeks, with US treasuries being scrutinised as the independence of the Federal Reserve comes into question more and more, particularly with Trump’s appointment of Stephen Miran to the Federal Reserve Board. Late last week he also announced his ‘top three’ candidates for Powell’s successor next year, naming Kevin Hassett, Chrisopher Waller and Keven Warsh, all of whom are likely to veer towards a more dovish stance on interest rates. At the end of the week the US dollar was lower as US labour market data disappointed. The nonfarm payrolls print was +22k versus an expected +75k, and this sent short end US yields lower with rates markets now fully pricing a 25bp cut from the Fed next week, and an increasing possibility of a 50bp cut. We have US CPI and PPI this week, which may reverse some of this sentiment, particularly PPI which indicated some significant pass through of tariffs into pricing at the last reading. The lower US dollar saw the Kiwi close the week back near 0.5900. A rebound in the US dollar would still see the Kiwi well supported at 0.5800/0.5820.
Of note, last week the NZDAUD cross touched a low of 0.8967 following the strong Aussie GDP print, but 0.8950 (a key technical level, being a triple bottom) is a tough nut to crack and the cross closed the week back at 0.8990. We may see a retracement back to the 0.9050 level this week. Mieneke Perniskie – Senior Dealer, Financial Markets.
Weekly Calendar
- On the Central Bank front, we’ll be hearing from the ECB on Thursday who are expected to leave monetary policy conditions unchanged. And the Central Bank’s messaging is expected to mirror July’s meeting, where officials signalled a “wait and see” approach—holding off on further rate cuts until the full impact of US tariffs and their economic implications can be assessed.
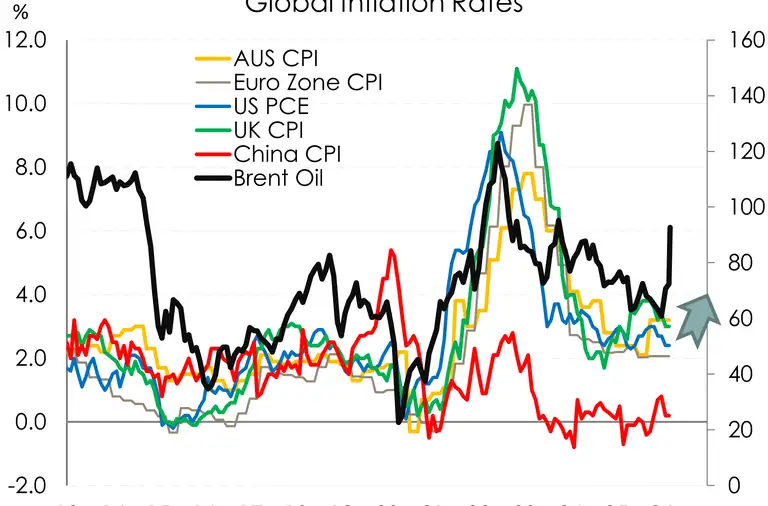
- US CPI & PPI data this week are expected to cool talks of a potential 50bps cut at the Fed’s September meeting. The previous PPI release showed a sharp 0.9% rise, the largest in three years, as firms passed on higher tariff-related import costs. However, a slower pass-through of just 0.3% is expected for August. On the consumer side, inflation is forecast to rise 0.3%, nudging the annual rate up to 2.9% from 2.7%. The increase is expected to be driven largely by discretionary services, while tariff-related price pressures remain muted. Core inflation is projected to hold steady at 3.1%
- In complete contrast to the US, China is expected to be re-entering into a period of deflation. Headline inflation is expected to come in at -0.2% in the year to August, down from a zero reading in July. A steeper decline in food prices largely responsible for the drag on prices. Meanwhile trade data out later today is expected to show slower Chinese export growth over the year to August as tariff pressures continue to weigh on the nation.
- At home we’ll be seeing the last of GDP partials this week - mainly Manufacturing data, for Q2 tomorrow. Given the consistent contractions in PMI over the quarter, the figures are likely to come in soft. Wednesday brings net migration data, which is expected to show continued below-average net migration inflows. And on Friday, electronic card spending figures are likely to remain somewhat subdued, as households continue to grapple with persistent cost-of-living pressures.
See our Weekly Calendar for more.
All content is general commentary, research and information only and isn’t financial or investment advice. This information doesn’t take into account your objectives, financial situation or needs, and its contents shouldn’t be relied on or used as a basis for entering into any products described in it. The views expressed are those of the authors and are based on information reasonably believed but not warranted to be or remain correct. Any views or information, while given in good faith, aren’t necessarily the views of Kiwibank Limited and are given with an express disclaimer of responsibility. Except where contrary to law, Kiwibank and its related entities aren’t liable for the information and no right of action shall arise or can be taken against any of the authors, Kiwibank Limited or its employees either directly or indirectly as a result of any views expressed from this information.