
- Inflation is hurting some more than others. It’s unfair. StatsNZ’s Household Living-Cost index showed that living costs for the average Kiwi household continue to ease. But there is a widening gap across different Kiwi households.
- Of all household types, those that spend the least, are experiencing the highest inflation. Followed closely by retirees and beneficiaries. Meanwhile households who spend the most, and those who earn the most, saw living costs rise at a much reduced rate.
- It’s a reversal of what we saw at the peak of the cost-of-living crises. It’s all to do with interest rates.
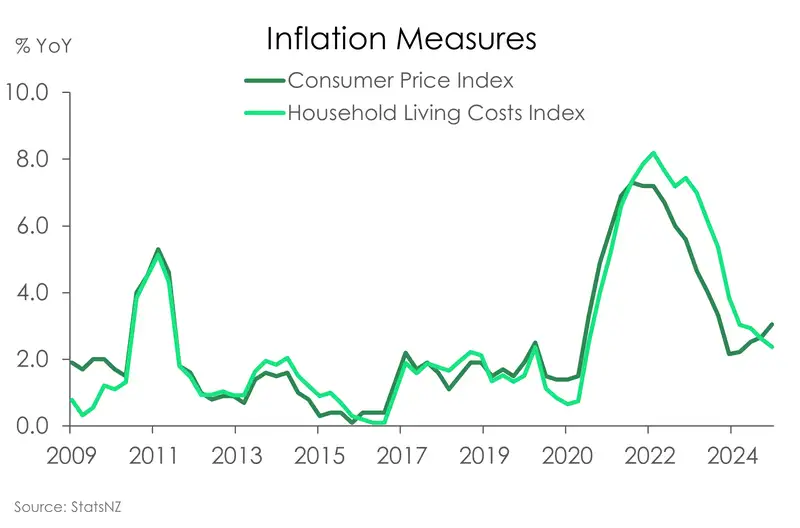
Over the past week commentators and economists alike (us included) have gone on about the recent rise in inflation to 3%. The message everywhere: Don’t panic! Inflation may be at the top end of the RBNZ 1-3% band... But it shouldn’t linger there for long. A return to 2% is incoming. That’s good news. And yet it just might not be your reality. Inflation may not even feel like it’s running at 3%. Spoiler alert, it’s probably higher. If you’re a beneficiary, superannuitant, or low-income household, then it IS more than 3%... a lot more in some cases.
When we hear about inflation, our attention usually goes straight to the Consumer Price Index (CPI). It’s an index measuring the change in prices for a basket of goods and services for New Zealand as a whole. The thing is, much like an actual trip to the supermarket, our trolleys can look quite different from others around us. Personal preferences, needs, incomes, and a number of demographic factors have an influence on what we’re putting in our baskets. And it’s these different basket compositions which means inflation is not experienced the same across different demographic groups.
Thankfully, there’s a lesser known index called the Household Living-Costs Price Index, (HLPI for short), which sets out to remedy this exact problem. Think of it as the younger sibling to the older, cooler, and certainly more popular Consumer Price Index (CPI). The two indexes capture the change in prices over time, and as such tend to move somewhat hand in hand. But in true sibling fashion, the two do have one distinct difference worth noting: The HLPI includes interest repayments, while the CPI does not. The difference between the two comes down to a design choice based on the intended purpose of each measure. Including interest repayments as part of the HLPI better aligns with its purpose to report on different household inflation experiences. While the CPI on the other hand, designed for monetary policy purposes, excludes interest repayments to avoid circularity within the measure.
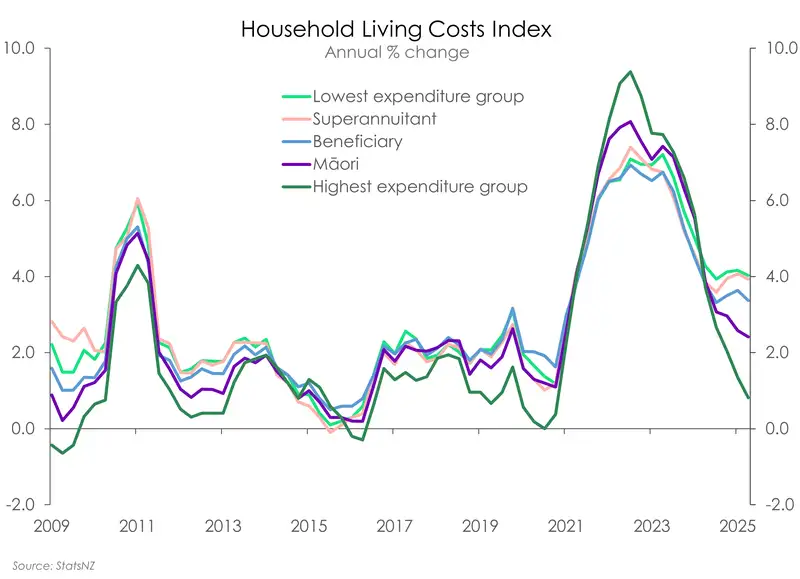
Put simply, the HLPI provides a further breakdown on inflation beyond the average household. And this is where things get interesting... The HLPI has fallen for the average New Zealand household. But digging into the detail, reveals a widening gap in the cost of living across different Kiwi households.
Living costs for the average Kiwi household were up 2.4% in the year to September 2025, down from 2.6% last quarter. But for households in the highest expenditure group, costs rose just 0.8%. In contrast, those in the lowest expenditure group, saw costs rise by 4%. Households that spend the least, and have the tightest budgets, are experiencing the highest inflation.
Household expenditure is often recognised as a better proxy of living standards than household income. That’s because a certain percentage of the population do not have steady streams of incomes. Nonetheless, we see a similar trend playing out across household income groups. Those with the highest incomes saw costs rise just 1.3% over the year. While those on the lowest incomes instead saw prices rise a larger 3.6%.
The disparities don’t stop there. Superannuitants and beneficiaries are also feeling the pinch with living costs rising 3.9% and 3.4% respectively. Māori households are faring a bit better, with living costs up a shallower 2.4%. But that’s still 3 times above the increase of those amongst the highest spending households.
A reversal is in play. And it’s all to do with interest rates
Back at the peak of the cost-of-living crisis in late 2022, households within the highest expenditure group were the ones facing the highest inflation. Meanwhile beneficiaries, superannuitants and those within the lowest expenditure group faced a lesser impact. It was an unusual trend to see. Households with lower standards of living tend to be the ones most vulnerable to inflation. And the data prior to 2021 supported as much. Something flipped, and it’s flipped again. We watched with “interest”.
Interest rates have been the leading driver behind the story of who’s paying the most. From the sharp rise over 2022-23, to the steep declines over the past year.
With interest rates now falling, interest repayments are down 14.3% for the average household. It’s a move which has had a sizeable impact in reducing living costs across all Kiwi. But one which has been felt most by households amongst the highest expenditure group as higher carriers of debt.
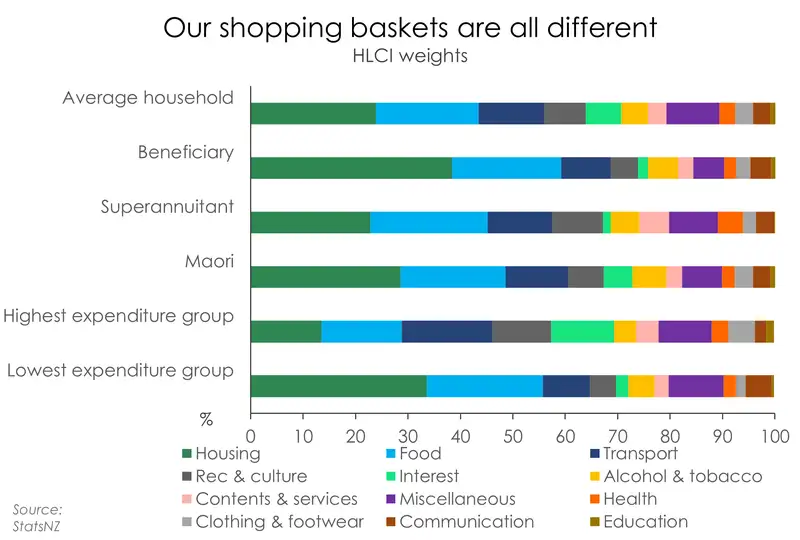
For households within the highest expenditure group, interest repayments hold a 12% weighting towards their cost of living. That’s almost double that for the average household (6.8%). So, when interest rates were rising, they were hardest hit. Now, the move down is providing relief. Interest repayments have fallen close to 15%. It’s the reason why these households are recording the lowest annual inflation, deducting as much as 1.8% from their cost of living.
For other groups, particularly superannuitants and beneficiaries, the fall in interest repayments, have had less of an impact. Repayments hold less than a 2% weighting for both groups. Simply because these households are less exposed to holding mortgages. For example, according to Stats NZ, just 8.5% of Kiwi retirees have a mortgage.
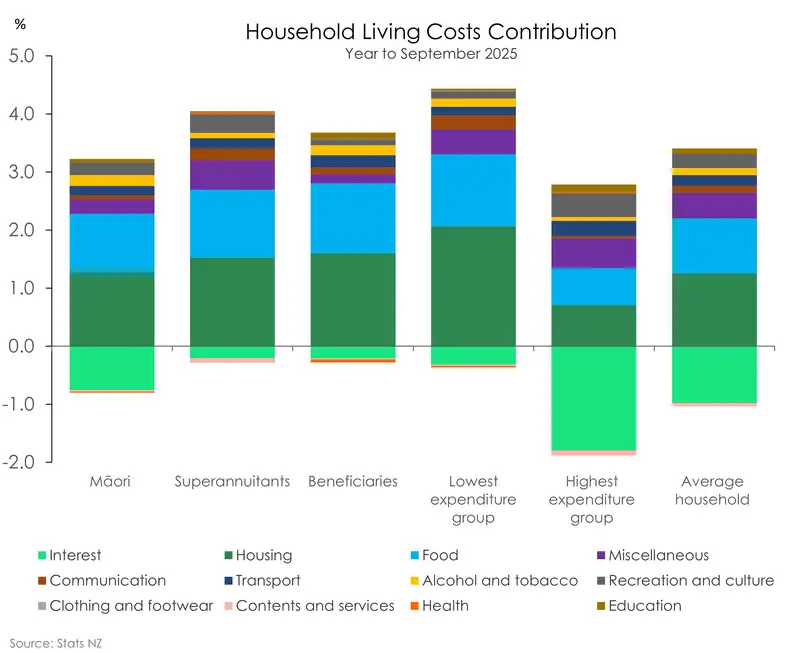
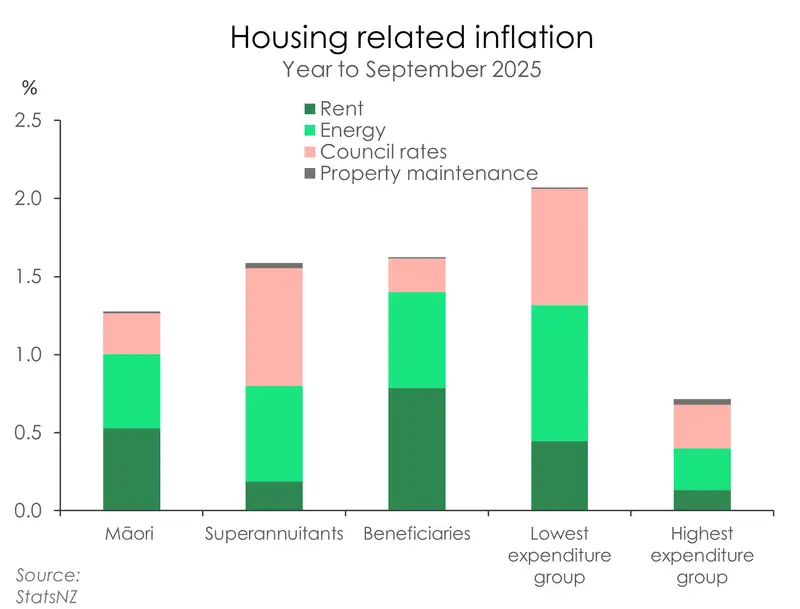
All households are feeling the pinch of rising costs across the housing and food groups. No surprises there. Both housing and food are two areas where the Consumer Price Index has flashed sizeable increases in prices over the past year. But within housing, where most of the inflation heat is coming from, separate subgroups are driving up living costs across Kiwi households.
For beneficiaries and Māori, the increase in rents has had the most significant impact on their cost of living with rents contributing 23% and 21% respectively to their annual inflation rate. Meanwhile, the nationwide 8.8% rise in council rates (as measured by the Consumer Price Index) contributed 18% to both the living costs of superannuitants and those in the lowest expenditure group. Additionally, those in the lowest expenditure group were most vulnerable to the lift in electricity prices (up 11.3% nationwide over the year) which contributed a further 19% to their sizeable 4% rise in annual living costs.
The outlook
Living costs across all Kiwi households continue to move in the right direction. It’s just that costs, helped by the interest rates, are falling faster and more decisively than others. Those with the most debt are getting the most relief. But food and housing related costs remain a pain point across all Kiwi households.
On the food side, we expect some of the recent price pressure to ease. Elevated global commodity prices have pushed up the prices for a number of dairy and meat products. But it does appear that we’re past the peak in food inflation.
However, the housing group is where stubborn price pressures are likely to remain. Rents may ease further amid a dormant housing market and weak migration flows. That would help beneficiaries and Māori households more. But the lift in council rates and energy costs are likely to weigh on budgets for some time as the rise in prices in these areas is in response to catching up on decades of underinvestment in infrastructure.
Nevertheless, we continue to see inflation measured by the Consumer Price Index easing back down towards and even below 2% by this time next year. And as inflation cools further, living costs have room to fall further too.
All content is general commentary, research and information only and isn’t financial or investment advice. This information doesn’t take into account your objectives, financial situation or needs, and its contents shouldn’t be relied on or used as a basis for entering into any products described in it. The views expressed are those of the authors and are based on information reasonably believed but not warranted to be or remain correct. Any views or information, while given in good faith, aren’t necessarily the views of Kiwibank Limited and are given with an express disclaimer of responsibility. Except where contrary to law, Kiwibank and its related entities aren’t liable for the information and no right of action shall arise or can be taken against any of the authors, Kiwibank Limited or its employees either directly or indirectly as a result of any views expressed from this information.