The cost-of-living crisis persists
For the past couple of years inflation has hogged the headlines. Just a few weeks ago, the latest inflation data had us on the edge of our seats. Headlines read “Inflation now at 4.7%. Still a ways away from the RBNZ’s 1-3% target, but a far cry from the 7.3% peak we saw in June 2022.” It’s been much of the same for a while now. Yet, even with all the talk and hype on inflation, the experience of it across different demographic groups receives less of the limelight.
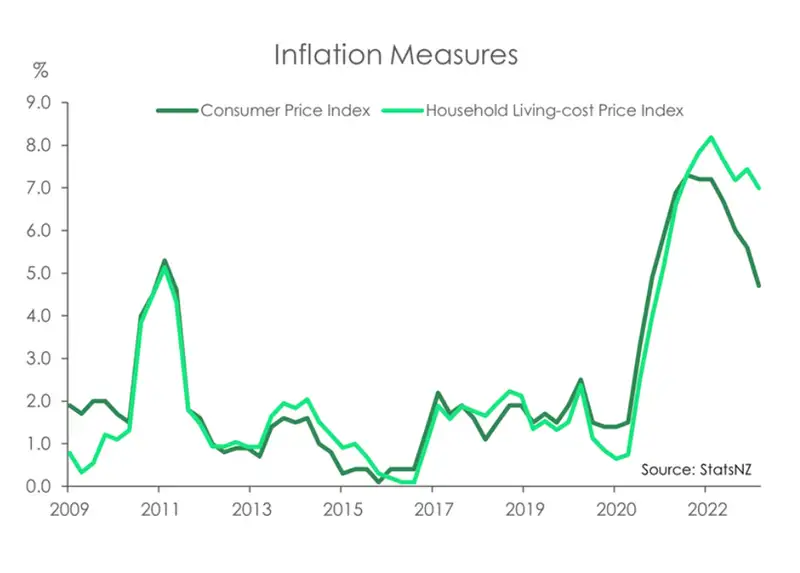
When we hear about inflation, attention usually goes straight to the headline number. The Consumer Price Index (CPI) measures the change in prices for a basket of goods and services for the average Kiwi household. It’s a glorious measure. One which us economist’s live and breathe. But it has two shortfalls...We only get it on a quarterly basis, and it’s just an average measure. And behind every “average” is a whole spread of data. A distribution which in a country as diverse as Aotearoa, is sure to be vast. And largely unreported.
The CPI basket of goods and services changes over time. But of course, not everybody’s basket looks the same, at any point in time. And the different basket compositions means inflation is not the same for different demographic groups.
Cue the Household Living-costs Price Index (HLPI). The measure is Stats NZ’s solution to capturing a wider picture of inflation
among groups of households. The HLPI (not CPI) gives a greater insight into the inflation experiences of 13 different household groups. It’s still no perfect measure. But nonetheless it opens up an avenue to some pretty important stories hidden within the usual headline inflation number for Māori, beneficiaries, superannuitants, as well as five expenditure groups and five income groups.
Before any further discussions, it should be noted that there is one distinct difference between the CPI and HLPI (technically there’s a couple more differences around how the data is aggregated, but no one cares). While the HLPI includes mortgage interest repayments, the CPI does not. The CPI instead tracks the cost of purchasing new dwellings (excluding land). The difference between the two comes down to a design choice based on the intended purpose of each measure. Including interest repayments as part of the HLPI better aligns with its purpose to report on different household inflation experiences. While the CPI on the other hand, used for monetary policy purpose, excludes interest repayments to avoid circularity within the measure.
A surprising twist...
Across economic discourse there’s a common rhetoric that households with lower standards of living are the ones most vulnerable to inflation. And there’s a number of reasons why.
Primarily, most of their incomes tend to be spent on necessities, leaving little leeway to reduce spending. Lower income households have less flexibility in the items they consume. When prices rise, its common to see consumers buying cheaper items, and cutting back on non-essential goods. But in many cases, those with lower incomes are already consuming the cheapest products. Prior to 2021, the low expenditure quintile experienced the highest inflation, while the higher expenditure quintiles experienced the lowest inflation. It’s unfair. Inflation discriminates, and can worsen inequality.
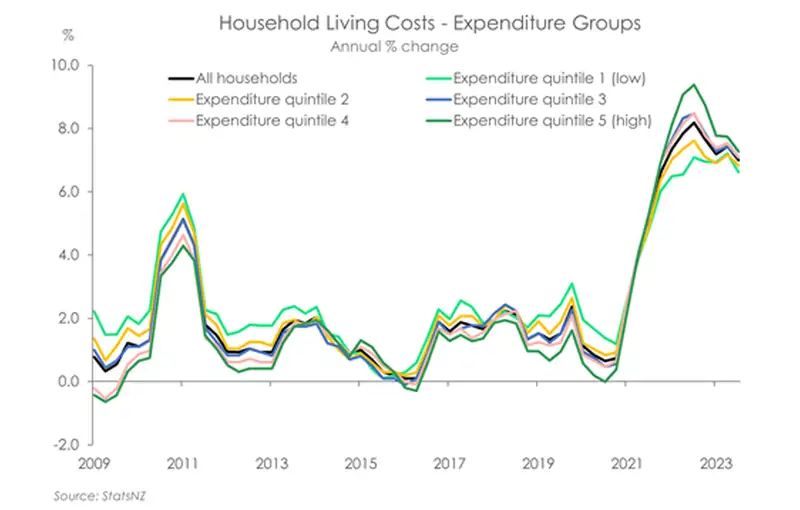
Looking at the data today however, we’re seeing the opposite. Of all the groups, it was households in the highest expenditure quintile that have faced the highest inflation. Having peaked at 9.4% in December 2022, inflation for those in the highest expenditure quintile has now eased to 7.3%. Meanwhile those in the lowest expenditure group have had inflation ease to 6.6% after averaging ~7% for much of 2023. It’s unusual.
So, what’s different this time?
The answer is right in front of us.
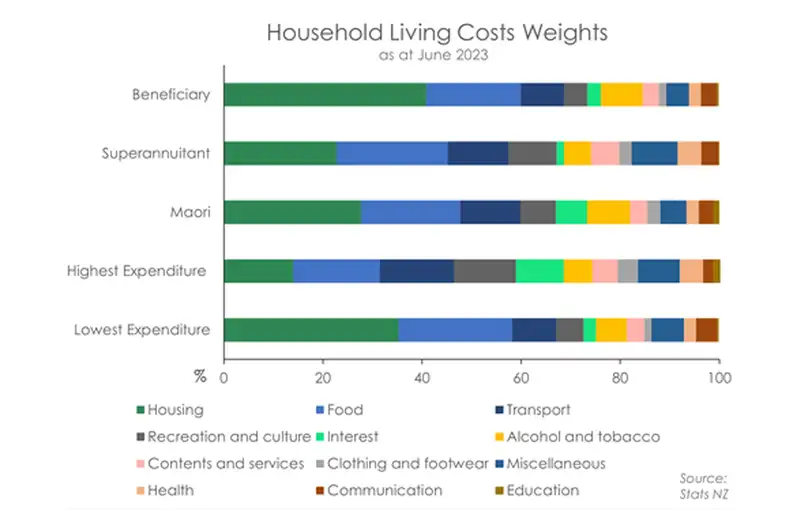
The RBNZ have delivered the most aggressive tightening cycle in our history. Interest rates were ratcheted higher and higher in order to bring down inflation. The official cash rate was lifted 525bps in just 19 months. That’s fed through to all interest rates in the economy. And it’s those in the highest expenditure group, with higher levels of debt, that are feeling it the most. For the highest expenditure groups interest repayments have a 9.6% weighting towards their cost of living. Whereas the lowest expenditure group has a weighting of just 2.3% on interest repayments. So, it’s no surprise to see interest rates contributing a solid 3% to the highest expenditure group’s inflation. Of all groups, they are currently feeling the biggest pinch.
For those in the lowest expenditure group, it was rents and food prices that contributed the most to their inflation.
Note: Studies suggest household expenditure as a better proxy of living standards than household income. Taking into account that a certain percentage of the population do not have steady streams of incomes. In the same way, consumption expenditure fluctuates less than incomes.
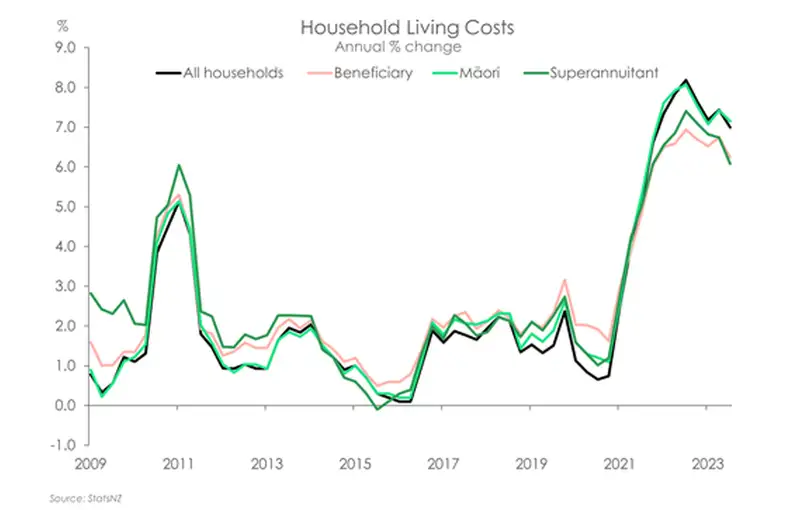
Beyond the expenditure groups, living costs for Māori increased 7.1%, down from 7.4%. While living costs for beneficiaries and superannuints were up 6.2% and 6.1% respectively. With lower levels of debt, superannuints and beneficiaries are not facing the same pinch from higher interest repayments as others. But like the lowest expenditure group, superannuints and beneficiaries have housing and food as the main contributor to their inflation. Based off the 2023 weights, housing inflation is contributing around 2.3% towards the total inflation felt for both beneficiaries and the lowest expenditure groups. Māori instead have higher interest repayments followed closely by housing as the leading contributors towards their higher cost of living.
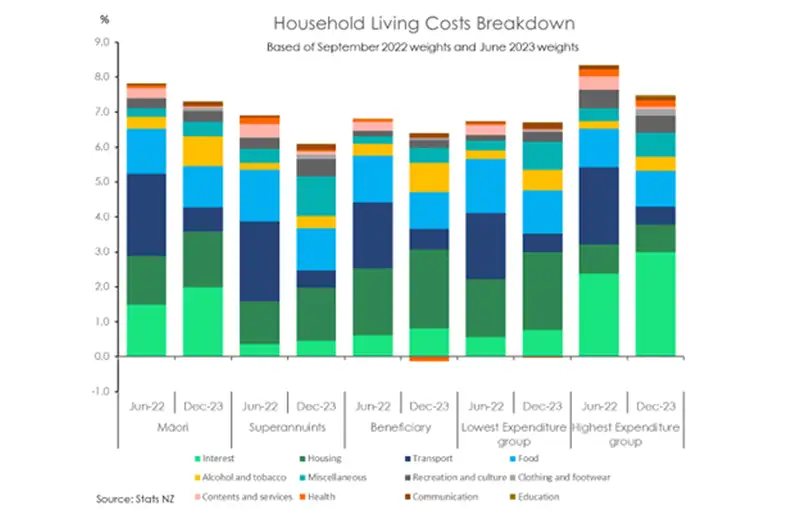
The underlying theme is clear. When inflation was at its peak in June 2022, rising transport prices, due to supply chain disruptions and the war in Ukraine, were having the largest impacts across households. Today, it’s all about interest repayments and housing. Those with higher levels of debt have interest repayments as the largest contributor their current cost of living. While those with lower levels of debt are being hit harder across housing and food.
Relief to come
Thankfully, relief is on it’s way. Inflation has eased and continues to decelerate. And as inflation comes down, living costs will follow. Housing inflation, particularly rents, however have some upside risk. With record levels of migration, compounding a housing shortage, rents have accelerated and remain above pre-covid levels.
On the other hand, the RBNZ’s heavy handed hikes are already having a meaningful impact. Because interest rates are a major contributor to the cost of living of many households. It’s further evidence that no more tightening from the RBNZ is needed.
Should the economy continue to develop in the way we expect, inflation will drop back within the RBNZ’s 1-3% target band in the second half of this year. At that point in time, we think the RBNZ will be in a position to cut rates, hopefully from November. Rate cuts will help relieve the significant financial burden on all households, especially those who have only recently entered the housing market.
HPI coverage
|
Maori Beneficiaries Superannuitants |
|
|---|---|
|
Expenditure quintile |
Equivalised 1 - adult household |
|
Expenditure quintile 1 (low) |
>$17,943 |
|
Expenditure quintile 2 |
$17,943 - $25,328 |
|
Expenditure quintile 3 |
$25,329 - $34,670 |
|
Expenditure quintile 4 |
$34,671 - $46,137 |
|
Expenditure quintile 5 (high) |
$46,138 + |
|
Income quintile |
Empty header |
|
Income quintile 1 (low) |
>$19,892 |
|
Income quintile 2 |
$19,892 - $28,307 |
|
Income quintile 3 |
$28,308 - $41,112 |
|
Income quintile 4 |
$41,113 - $55,365 |
|
Income quintile 5 (high) |
$55,368+ |
Important disclaimer: This note has discussed the level of inflation faced by different households. And this should not be confused with how well any group can absorb these price increases. For example, those in the higher expenditure groups may have larger cash buffers to get them through a period of high inflation. Varying levels of marginal propensity to consume across these household groups also has an impact."
All content is general commentary, research and information only and isn’t financial or investment advice. This information doesn’t take into account your objectives, financial situation or needs, and its contents shouldn’t be relied on or used as a basis for entering into any products described in it. The views expressed are those of the authors and are based on information reasonably believed but not warranted to be or remain correct. Any views or information, while given in good faith, aren’t necessarily the views of Kiwibank Limited and are given with an express disclaimer of responsibility. Except where contrary to law, Kiwibank and its related entities aren’t liable for the information and no right of action shall arise or can be taken against any of the authors, Kiwibank Limited or its employees either directly or indirectly as a result of any views expressed from this information.


