

- What a year it’s been for the Kiwi dollar. We’ve been all over the place as recoveries stopped and started, global trade rules were rewritten, and the dominance of the US dollar was questioned. There was a lot of volatility. 2026 will be no different, but the outlook for the Kiwi is higher.
- The RBNZ has seemingly called time on the easing cycle. With monetary policy clearly stimulatory, we forecast a robust recovery for the Kiwi economy. If all goes to plan, the Kiwi could hit 63c next year.
- As always, risks are abound. Rate hikes are being priced in for 2026. That’s too soon. The tightening in market conditions has gone too far. And the RBNZ agree. The Kiwi dollar may face some short-term weakness as market pricing recalibrates.
The Kiwi flyer (NZDUSD) has been on one heck of a ride this year. We may have ended the year close to where we started, but it’s been anything but a straight line. We began 2025 on the backfoot with a 55cent-handle. Then just as the Kiwi economy was recovering and the NZD was on the way up, Liberation Day came and conquered financial markets. Trumpian tariffs saw the Kiwi drop to the lowest level in 16 years as forecasters painted nightmarish outlooks for the global economy. At the same time, (misplaced) fears of the end of the US Greenback’s reign as the world’s reserve currency were circulating. The Kiwi benefitted and recovered to a touch above 61c in July. From there, the trajectory turned south. The local economy lost momentum, the RBNZ delivered a 50bps cut in October and the Kiwi flyer’s wings were clipped. Now, the RBNZ’s cutting cycle is coming to a close. The Kiwi dollar has bounced off the November lows, and looks set to end the year oscillating around 58c. That’s the 2025 recap. Now we’re left contemplating what’s in store for the Kiwi dollar in 2026.
We’re expecting a recovery in the economy, and with that, we’ll see a recovery in the Kiwi (check out our 2026 economic forecasts). If all goes according to plan, and that’s a big IF, then the Kiwi could hit 63c next year.
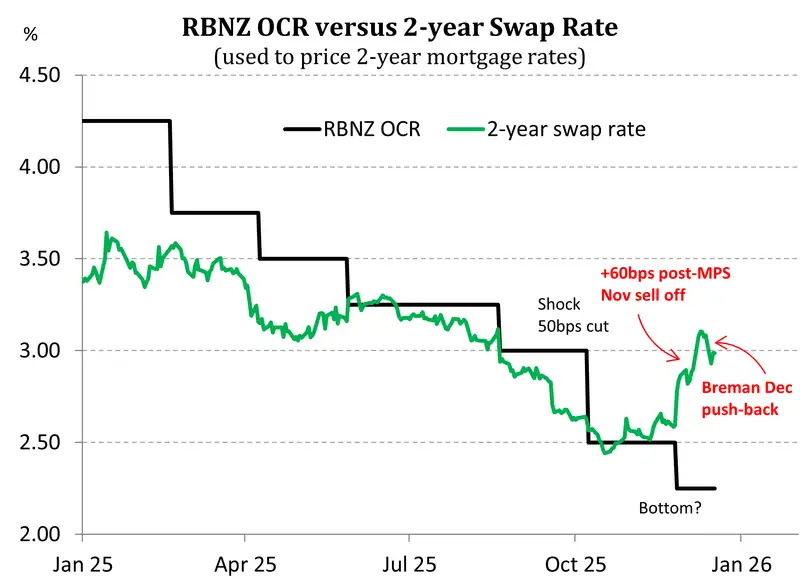
It's not all easy and straight forward, however. The RBNZ is again at the centre of some confusion. Although the RBNZ cut rates, with the obvious intention of lowering retail rates for businesses and households, a higher-than-expected OCR track has catapulted wholesale rates higher. Traders are now factoring in rate hikes (no longer cuts) in 2026. That’s way too aggressive and premature. Everything needs to go well, really well, for an economy with such a deep output gap, deflationary pressures, and soft labour market, before we can consider hikes. It’s likely to be a discussion for early in 2027… but not now. 2026 will need to be the year of material recovery.
The RBNZ’s misstep is all-too familiar. Over the last few years, the RBNZ has bounced around from being hawkish in November, dovish in February, hawkish in May, and then dovish in August. There seems to be some seasonality to their mishaps. The RBNZ’s miscommunication in November, along with climbing wholesale rates, and higher retail lending rates, suggest we may indeed get another dovish commentary in February. It’s silly… we know. But should the RBNZ pour cold water on the fiery sell off since the MPS, then the Kiwi dollar could see some renewed downward pressure in the near-term. Recent comments from new Governor Dr Anna Breman have so far had that effect, to some extent. Will we get back down to the 55c range? On domestic factors alone, probably not. Not without the RBNZ stepping in and cutting the cash rate again. The Nov OCR track has kept that door ever so slightly open. But the recent flow of improving data suggests a diminishing need for further easing.
If the market is right, and we start to see the cash rate rise in 6-12 months time, then we have seen the lows in interest rates, and all rates will be materially higher over 2026. In this world, the Kiwi currency breaks back above 60c, and ends the year in the mid-60s or higher.
If our view that the RBNZ holds into 2027 (as they’ve signalled) does materialise, then we have seen the lows in wholesale rates. In this world, the Kiwi currency holds below 60c for 3-6 months, and then ends the year close to 63c as hikes come closer. We agree with the RBNZ’s forecast trajectory, but we were disappointed with the delivery. The RBNZ’s last cut could have been delivered without tightening financial conditions. It just makes it a little harder to recover.
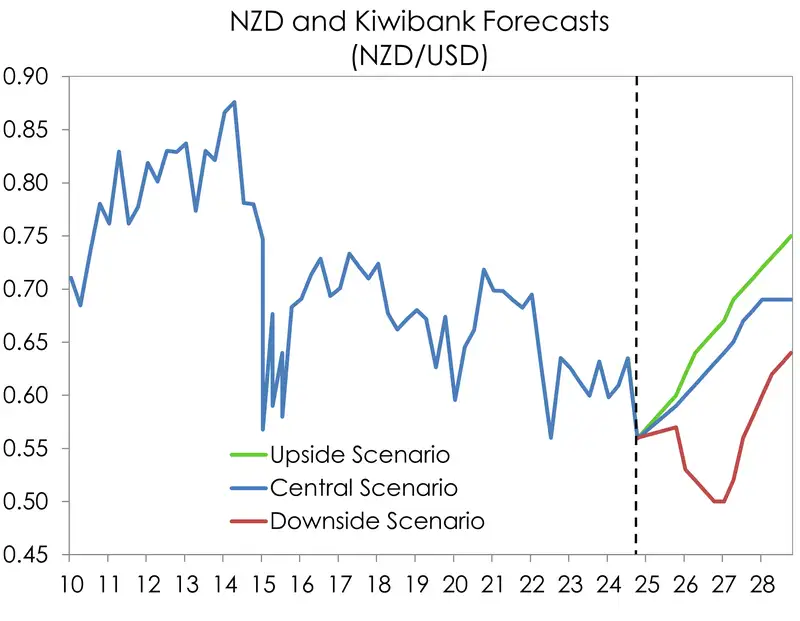
It’s not all rosy outlooks. There are significant risks to the downside. If we move down our downside scenario, we could see a cash rate below 2%, possibly 1.5%. And let’s face it… the downside risks have materialised over the last two years. We hope this time is truly different. In a downside scenario, the Kiwi currency does what is asked of it, it depreciates. We could see a move towards 55c, and if we get a cash rate of 1.5%, then 50c is possible.
The play for the Kiwi against the Aussie is also an interesting one. The NZDAUD hit a multi-year low of 85.94c in November. But the cross has found support and regained some footing at the 87c level after the RBNZ seemingly called time on the easing cycle. There’s further upside for the cross in 2026 as the Kiwi economy strongly recovers.
One factor clouding the forecast for a higher NZDAUD is that the central bank across the ditch is already onto the next chapter of monetary policy: rate hikes. The last chapter was a fairly short one – just 75bps of cuts to date. But inflation in Australia is proving persistent. And the RBA Governor Michelle Bullock is “uncomfortable with the level of inflation”.
The Aussie inflation beast is rearing its head again. Truly, it was hardly hidden to begin with. Because the RBA opted for a lighter touch when it came to tightening in 2022-23. The beast was never really put away. And today, headline inflation has accelerated to 3.8% over the year to October. Meanwhile annual trimmed measures of inflation, a key focus for the RBA, has climbed to 3.3%. With both of these measures sitting above the 2-3% target band, the RBA have gone from an already cautious stance to a more hawkish stance at their December policy meeting. With each data release, the next move for the RBA is looking more likely to be up, not down. Markets are already pricing in 32pts by this time next year. If delivered or even if the market prices in more cuts, we’d likely see the Aussie dollar outperform the Kiwi.
Trading view, what’s next?
Mieneke Perniskie – Senior Dealer, Financial Markets
It’s certainly been an interesting year for the Kiwi dollar. We’ve had a lot to contend with, including tariffs which saw the Kiwi dollar hit a low of 0.5534, and then a full unwind of that pessimism as the US dollar came under pressure. We were then at a short lived high of 0.6100. That was all in Q2 and Q3. Since then, we have traded in a much tighter, generally lower range in Q3, as the RBNZ delivered further easing to the OCR, and our economy dragged itself through a prolonged period of stagnation. In our last FX Tactical the Kiwi dollar was trading in the low 0.5800’s and we highlighted that we would likely see downside into the 0.5700’s as further easing to the OCR was delivered. This certainly came to fruition, with more downside than we anticipated following the soft Q2 GDP print, and the sudden dovish turn from the RBNZ in October. The Kiwi ended up at a low of 0.5623, and then 0.5584.
Since the RBNZ’s MPS in November, we have appeared to turn another corner, with the bottom for the Kiwi now apparently behind us. The market view on the RBNZ, and indeed in their own MPS, is that they are more than likely than not, done with their easing cycle. The possibility of further easing indicated in their OCR track, was a mere 20%. This has seen a swift turnabout for the Kiwi, which now sees little chance of further rate reductions, and therefore the interest rate differential story sees the Kiwi dollar outperforming versus the US dollar. We could argue that the moves in Kiwi rates markets are a little over done (as Dr Breman pointed out earlier this week). But with mortgage flows amongst major banks pushing rates in one direction only, we may see some further upside from here (at least in the short term).
This comes to what we think will happen for the Kiwi over the first quarter of 2026. Given the turn in Kiwi sentiment on the back of the RBNZ, and the expectations of the market for additional easing from the Fed than they themselves have indicated, there is plenty to support the Kiwi in the very short term. We expect that the 0.5788 (38.2% Fibonacci) and 0.5710 (23.8% Fib) levels on the downside, remain as firm support levels for the Kiwi. We have recently had a run up to 0.5852 (50% Fib) but failed to break through. The next upside target is 0.5915. If there is a continuation of softening for the US dollar, then these are the next target levels in the coming quarter. Expectations of further Fed easing are likely to gain momentum, especially considering the soon to be announced new Fed Governor starting in May 2026. The market is expecting that it may be a somewhat politically aligned (to Trump) ‘major dove’, that will see further Fed easing delivered across 2026/2027. This supports our view for a higher Kiwi.
Beyond the upcoming quarter, there is further potential for the Kiwi to track higher. But that will need to be on the back of fundamentals in the economy pushing the recovery story. While we have seen some upsides starting to come through in the high frequency data, we have very real concerns that the moves in wholesale rates, arguably brought about by the RBNZ’s hawkish cut at the November meeting, may potentially derail some of the optimism that we’ve been seeing. If the expected strength in the Kiwi economy does not come to fruition over the summer months, then come February, the RBNZ may need to push some further momentum via the OCR with either an additional cut, or a dovish OCR track. If this is looking like a likely scenario, then the upside in the Kiwi will quickly unwind, back to the initial supports of 0.5788/0.5710. In a nutshell, we are saying: sure, Kiwi dollar higher BUT we really need to see that good story proves not to be a fairytale.
On the NZDAUD front, we also see some upside, but not of the same magnitude. After hitting multi year lows in November, at 0.8594, we were looking for a potential break further into the 0.8500’s. The RBNZ’s apparent reticence to show real optionality towards further OCR easing if required in their OCR track, has given the NZDAUD cross support to head back into the 0.8700 levels. This is despite the hawkish stance from the RBA at their last meeting, and the likelihood that the RBA may now be finished with easing. We see the current levels for the NZDAUD cross as a strong support level in the short term, but again if we see a derailment in the already perilous NZ economic momentum, then that may prove to be short lived. A softer economic scenario for the Kiwi could see some further downside if combined with a hawkish RBA (i.e. hikes in 2026), potentially to the 0.8400’s. But we are not there yet. In the short term, we see 0.8650-0.8850 as the likely track for Q1 2026, given the current momentum.
Kiwi crosses in the months ahead
Hamish Wilkinson – Senior Dealer, Financial Markets
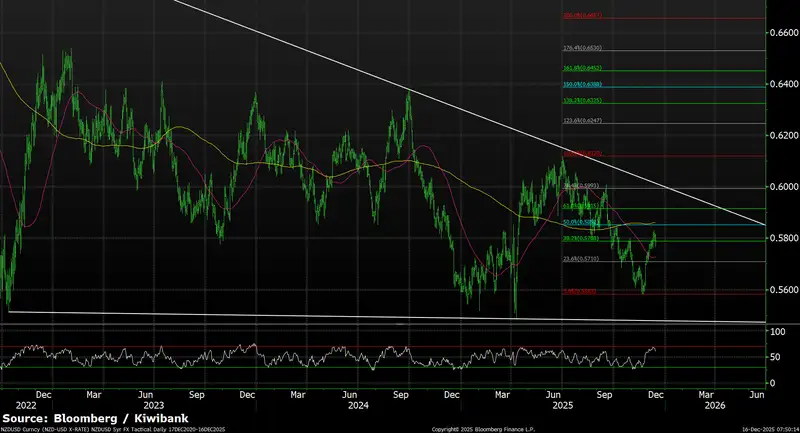
NZDUSD (3-year daily) – optimism is growing that the bottom is in
The Kiwi has rebounded from November lows near 0.5584 after the RBNZ signalled its easing cycle is complete. But recent dovish remarks from Governor Breman warning that markets may have “overtightened” could trigger short-term weakness. Technically, NZD/USD faces strong resistance at the 50% (0.5852), 61.8% (0.5915), and 78.6% (0.5993) retracement levels, which align with the broader downtrend and the 200-day MA around 0.5860. The RSI’s recent move into overbought territory adds to near-term consolidation risk, even as Fed easing expectations and USD softness provide medium-term upside potential. Failure of a domestic recovery could see a reversal back toward 0.5710 or even 0.5530. But we are optimistic that the bottom has now been reached and 2026 may see increased risk of an eventual break higher out of the broader multi-year triangle structure.
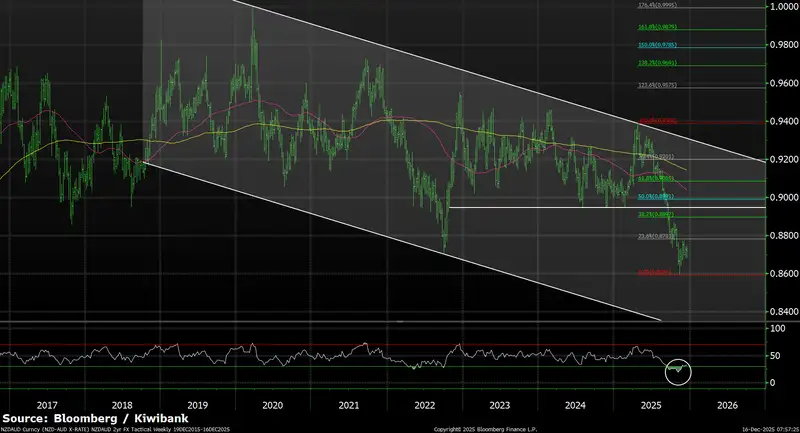
NZDAUD (10-year weekly) – those Gold Coast holidays can’t get any more expensive, can they?
NZD/AUD remains under pressure within its long-term descending channel after hitting a low near 0.8594 in November. While the RBNZ’s signal that its easing cycle is complete has offered short-term support, the broader backdrop favours AUD strength, with the RBA’s hawkish stance and 25bp+ of tightening priced for 2026 contrasting with the risk of an unwind in RBNZ pricing if NZ’s recovery falters. Technically, retracement levels to watch are 0.8781, 0.8897, 0.8991, and 0.9085, with 0.8950 a key hurdle for any upside recovery. The RSI remains oversold, which could support a corrective bounce toward these levels in the short term, even as the descending channel keeps the medium-term trend bearish. Risks include a retest of 0.8600 or even 0.8400 if NZ data disappoints, while sustained AUD support from China’s recovery and RBA hawkishness keeps downside risks dominant
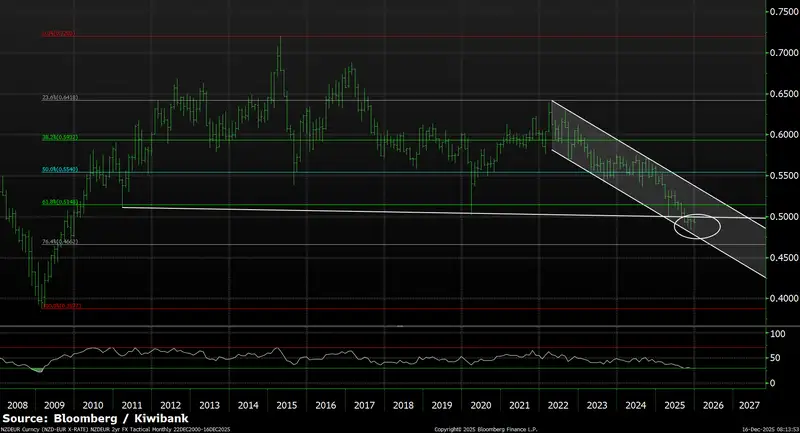
NZDEUR (20-year monthly) – entering No Man’s land
NZD/EUR remains under pressure after hitting lows last seen in late 2009, and breaking below 0.4950 in the last quarter (a risk we highlighted in the last tactical). This leaves this cross in “no man’s land” near the lower end of its multi-year descending channel. Reclaiming 0.4950 is critical for any recovery toward the top of the channel, but near-term fundamentals lean bearish. The ECB is expected to signal that its next move in rates is likely higher, adding downside risk to the cross. Failure to recover could see a drift toward 0.4800 or lower, while any surprise dovish tone from the ECB or stronger NZ data could allow a corrective bounce toward 0.5150–0.5200.
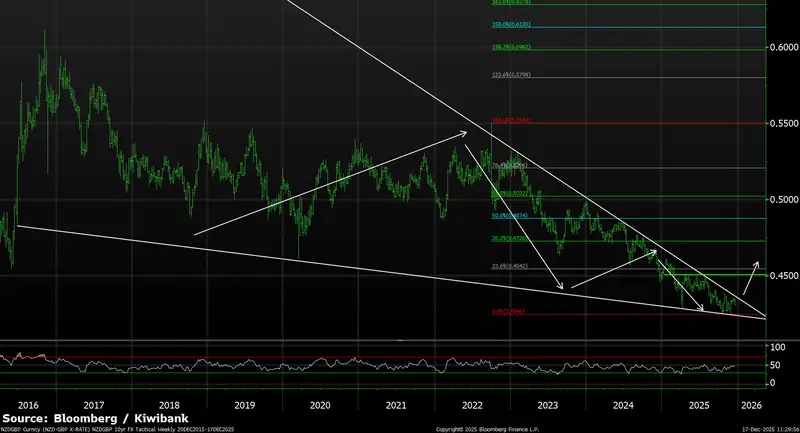
NZDGBP (10-year daily) – potential major trend reversal is on the cards
NZD/GBP, in recent weeks, has been looking to test the upper end of a multi-year downtrend, but remains capped by major resistance around 0.4350/60. A break above this zone would be significant, potentially signalling a major change in the broader outlook. The technical picture is increasingly constructive, with a falling wedge pattern developing, which is typically a bullish reversal signal; a confirmed breakout above 0.4350/60 could target 0.4500/50, then 0.4720. Fundamentally, the RBNZ’s shift to a neutral stance—and the possibility of its next move being higher in late 2026—supports upside potential, while UK fiscal risks and expectations for continued BOE easing toward 3.5% by late 2026 add a dovish bias for GBP, reinforcing the breakout scenario. On the downside, the bottom end of the wedge picture from 0.4246 through to 0.4220 will act as shorter-term support, whilst 0.3940 remains on a now distant horizon.
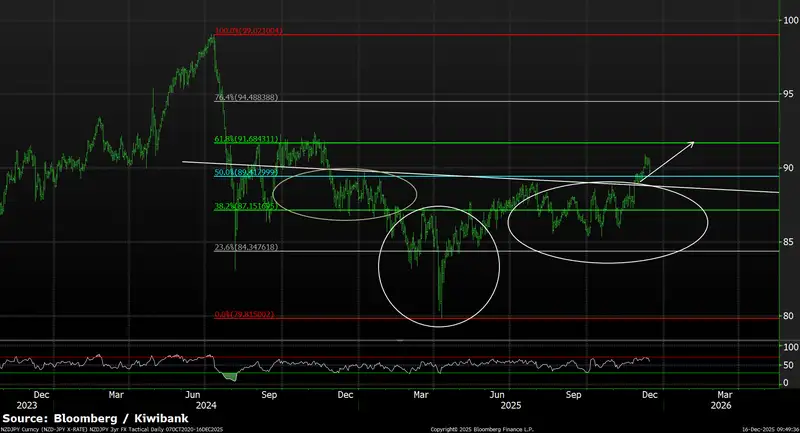
NZDJPY (2-year daily) – it’s not just a head treatment
NZD/JPY recently broke higher from a prolonged consolidation phase, supported by an inverse head-and-shoulders pattern, signalling potential upside toward 91.50–91.70 after clearing the neckline near 89.00. However, the rally stalled as the RSI reached overbought territory, triggering a modest pullback below 90.00, which may act as near-term resistance. Fundamentally, recent changes in Japanese government leadership have introduced a fiscally stimulatory policy stance, conflicting with the BOJ’s tightening approach and fuelling JPY weakness amid concerns over JGB yield dynamics. This divergence, combined with the RBNZ’s neutral pivot and Fed easing expectations, favours further NZD/JPY upside once the overbought correction stabilizes, though volatility will persist given BOJ credibility risks and global risk sentiment.
Glossary
Commodity currencies: include the Kiwi dollar, Aussie dollar, Canadian dollar, Norwegian krone as well as currencies of some developing nations like the Brazilian real. These countries export large amounts of commodities (raw materials like oil, metals and dairy) to the world. And commodity currencies are highly correlated with the global prices of such commodities. When the global economy is strong and demand for commodities is high, commodity prices and thus commodity currencies, tend to outperform. The Aussie and Kiwi dollars are famously known for the sensitivity to good news (risk on) and bad news (risk off).
Interest rate differentials: The difference between the interest rates earnt on two different currencies. New Zealand may offer a significantly higher interest rate than those in Japan, for example, and we see an inflow of Yen into Kiwi dollars (known as the “carry trade”). The widening, and narrowing, of interest rate differentials can have a material impact on capital flows and therefore the exchange rate.
Monetary hawk (hawkish) and Monetary dove (dovish): Characterisations of central bank monetary policy. The hawk is a bird of prey and describes a central bank aggressively raising interest rates to slow economic growth and tame the inflation beast. The peace-loving dove however, reflects a central bank trying to stimulate economic growth by cutting interest rates.
Moving averages: A common method used in technical analysis to smooth out price data by showing the average over various time periods.
Relative Strength Index (RSI): is a popular momentum indicator used by forex traders to measure the speed and change of movements in currencies. It is a useful tool to evaluate overbought or oversold market conditions, in turn signalling whether a currency pair is due a trend reversal or a corrective pullback in price. Low RSI levels indicate oversold conditions (buy signal), while high RSI levels indicate overbought conditions (sell signal).
Reserve currency: The US dollar is the global reserve currency. The dominance of the US dollar in international trade means most central banks and financial institutions hold large amounts. The majority of FX reserves are held in US dollars. The US currency and debt markets are the most liquid in the world. And liquidity (the ability to buy and sell, especially in times of stress) is important. The next most traded currency is the Euro, but it is nowhere near as popular as the US dollar. About 60% of global reserves are held in dollars, with the Euro attracting only 20%, according to the IMF.
Safe haven currencies: A safe haven currency is one where investors hide from extreme market turbulence. The US dollar tops the list of safe haven currencies. But the Yen and Swiss Franc are also beneficiaries of save haven flows (money searching for safety). If a war breaks out tomorrow, we’re likely to see a spike in the USD, Yen, and Swiss Franc. The Kiwi dollar would be hit quite hard, and fall against these three currencies. Gold is also considered to be a safe haven asset during times of stress.
Support and Resistance levels: These are chart levels that appear to limit a currency’s price movement. A support level limits moves to the downside; a resistance level limits moves to the upside.
Terms of trade: The ratio of the prices at which a country sells its exports to the prices it pays for its imports. Put simply, terms of trade is a measure of a country’s purchasing power with the rest of the world. How many imports can be purchased per unit of exports – import bang per export buck. An increase in our terms of trade means New Zealand can purchase more import goods for the same quantity of exports. And a rising terms of trade lifts the incomes of exporters and the businesses and communities that support them.
All content is general commentary, research and information only and isn’t financial or investment advice. This information doesn’t take into account your objectives, financial situation or needs, and its contents shouldn’t be relied on or used as a basis for entering into any products described in it. The views expressed are those of the authors and are based on information reasonably believed but not warranted to be or remain correct. Any views or information, while given in good faith, aren’t necessarily the views of Kiwibank Limited and are given with an express disclaimer of responsibility. Except where contrary to law, Kiwibank and its related entities aren’t liable for the information and no right of action shall arise or can be taken against any of the authors, Kiwibank Limited or its employees either directly or indirectly as a result of any views expressed from this information.