
Domestic inflation, continues its (slow) move south. Annual non-tradables inflation has fallen to 3.5% from 3.7%. Domestic inflation has fallen some way from its 6.8% peak in 2023, but it is still sitting above the long-term average (~3%). And that’s despite such a weak domestic economy.
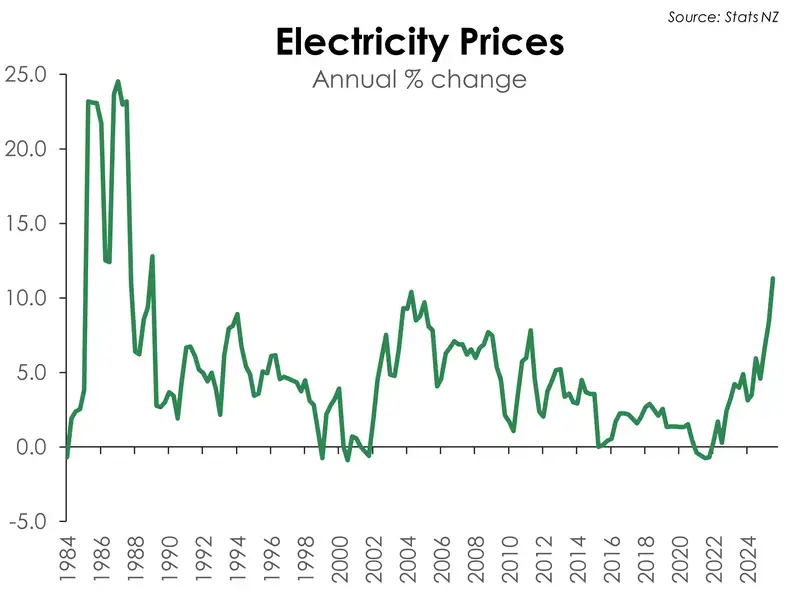
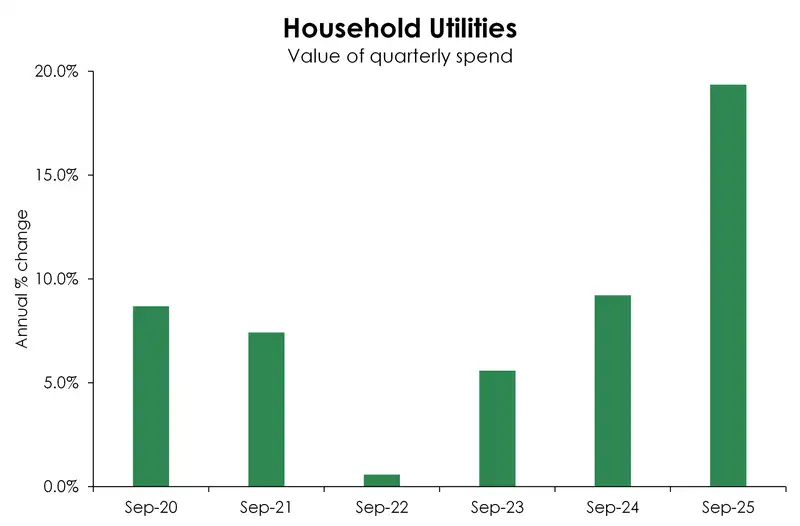
Such persistence is due to the lingering strength in administered prices. Most of which is coming through the housing group. Contributing close to 45% of the lift in prices over the quarter and 35% over the year, the housing and household utilities group is where most of the inflation pain is being felt. Within that, council rates and electricity prices are the biggest upward drivers. Over the quarter council rates, up 8.8%, accounted for 30% of the quarterly lift in prices. Meanwhile, electricity prices up 11.3% over the year are the highest since the late 1980s. The price effect is showing up in our internal card spend data. In our latest look into consumer spending (“Splurging on Essentials”), we saw that total dollars spent on household utilities has increased an eye-watering 19.3% in the September quarter compared to last year.
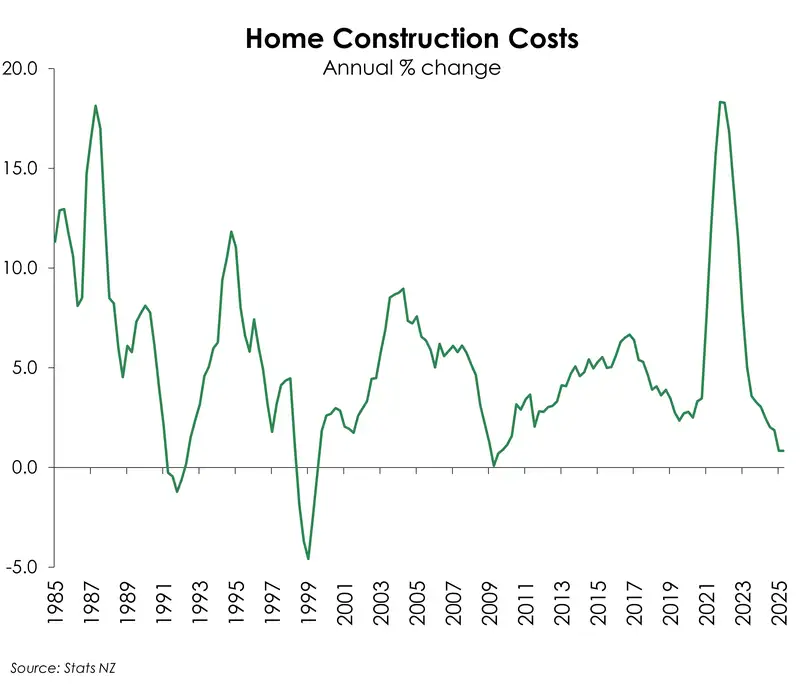
These so-called cost-push inflation movements are being offset to some extent by weak price growth in other components of housing-related inflation. Construction costs are still running at the weakest rate since the end of 2009 (0.8%yoy), while rental inflation fell to sub-3%. Our dormant housing market as well as weak migration flows are having a clear impact.
If we exclude these government administered costs, domestic inflation sits at a 2.6%. And that’s a better reflection of the current weak state of the economy.
All content is general commentary, research and information only and isn’t financial or investment advice. This information doesn’t take into account your objectives, financial situation or needs, and its contents shouldn’t be relied on or used as a basis for entering into any products described in it. The views expressed are those of the authors and are based on information reasonably believed but not warranted to be or remain correct. Any views or information, while given in good faith, aren’t necessarily the views of Kiwibank Limited and are given with an express disclaimer of responsibility. Except where contrary to law, Kiwibank and its related entities aren’t liable for the information and no right of action shall arise or can be taken against any of the authors, Kiwibank Limited or its employees either directly or indirectly as a result of any views expressed from this information.