

The Kiwi housing market ended 2025 on a slightly better note. House prices lifted a seasonally adjusted 0.2% over December. And in doing so, broke a 2 month streak of price declines. Over the year though, house prices nationwide were still down 0.4%, reflecting yet another sluggish year for price growth.
At least you can’t fault the market on activity though. Sales were up 8% over December, compared to the year prior. And while there’s still plenty of room for improvement, the median days to sell, one of the best real-time indicators of housing dynamics, has also settled lower at 45 days, compared to 48 days a year ago.
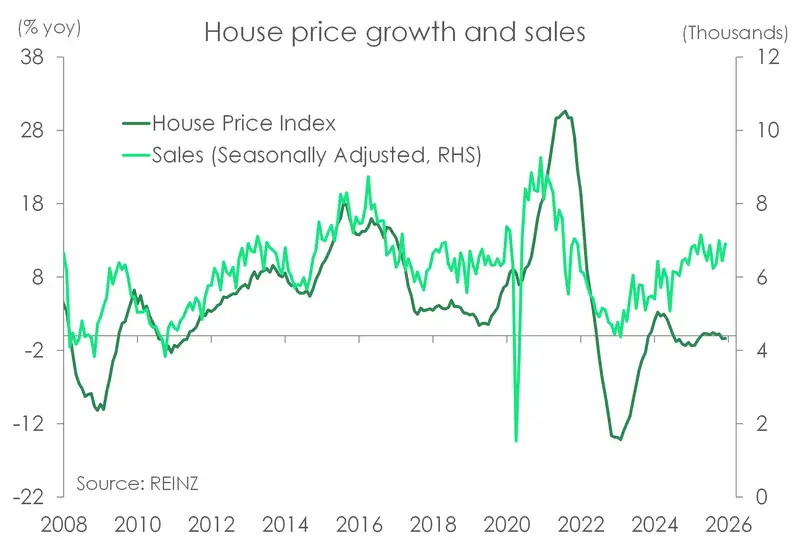
Buyers also remain flush for choice with continued strength in the number of new listings coming onto the market. In fact according to realestate.co.nz , housing stock levels hit a 10-year December high. That’s great if you’re on the housing hunt. Less great if you’re waiting to see some price growth action. Because despite the fall in interest rates providing a tail wind for the housing market, elevated stock levels paired with weak population growth are capping price growth near term.
Still the pick up in activity is encouraging, and bodes well for the housing market in the year ahead. We continue to expect a modest recovery in house prices, with growth of about 2-3% this year. That’s not exactly shooting the lights out, but it is an improvement from trekking sideways over the last two years.
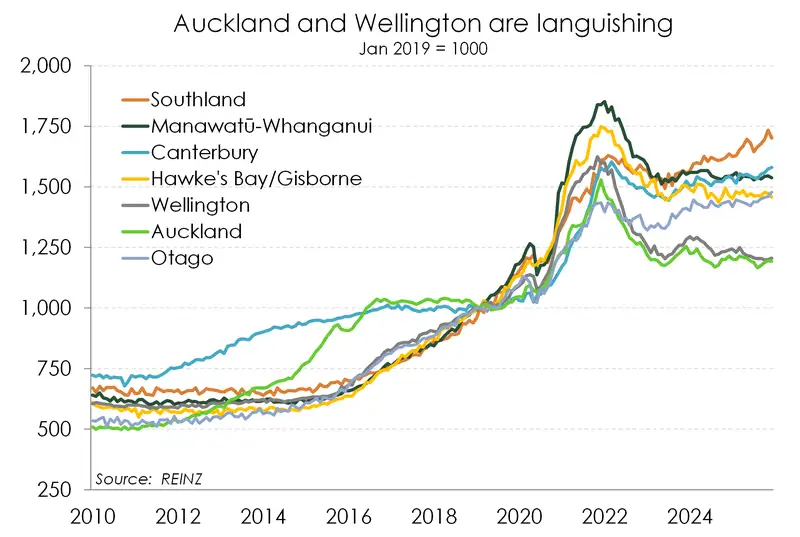
The regional picture is of course more diverse. We’ve witnessed a stronger performance across the South Island, while markets in the North Island have remained crippled. Wellington in particular just can’t seem to catch a break. Over the year, prices were down 4.5% for the windy capital. That takes prices 1.3% below levels in May 2023 when national house prices troughed. Activity indicators are also still running backwards. The median days to sell (seasonally adjusted) in Wellington has climbed back up above 50 days – a far cry from its long-run average of 37 days.
All content is general commentary, research and information only and isn’t financial or investment advice. This information doesn’t take into account your objectives, financial situation or needs, and its contents shouldn’t be relied on or used as a basis for entering into any products described in it. The views expressed are those of the authors and are based on information reasonably believed but not warranted to be or remain correct. Any views or information, while given in good faith, aren’t necessarily the views of Kiwibank Limited and are given with an express disclaimer of responsibility. Except where contrary to law, Kiwibank and its related entities aren’t liable for the information and no right of action shall arise or can be taken against any of the authors, Kiwibank Limited or its employees either directly or indirectly as a result of any views expressed from this information.