
Last week our chart of the week focused on US PMI data. So naturally, this week we’re taking a look at PMI data here at home. After nearly two years of being in contractionary territory (a reading below 50), the Kiwi manufacturing PMI had found a breath of life over the start of this year. The first four months of 2025 saw the index finally back in expansion with monthly readings ranging between 51.8-54. At the same time, other sub-indexes of the PMI survey, notably production, employment and new orders were also signalling expansion. Momentum in manufacturing was clearly building over Q1, and we expect to see that reflected in this week’s GDP numbers.
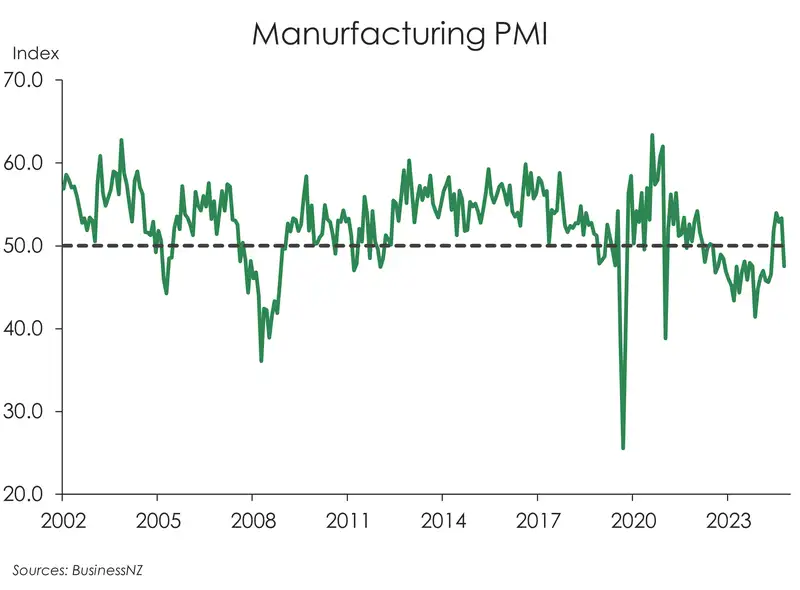
However, it seems like the strength in the industry may be short-lived. Last week, the latest manufacturing survey saw the the index fall sharply from 53.3 to 47.5 in May. And, along with the headline rate, most sub-indexes posted a great fall too. For example, new orders dropped 5.5 points to 45.3. Meanwhile, the employment sub- index fell 8.9 points to 45.7 – the largest single monthly fall in the survey’s 22-year history!
Both offshore, and now at home, low confidence amid economic fragility and tariff uncertainty is resulting in softening demand and orders across manufacturing. And it’s something which could very well and quickly spread to other sectors of the economy. It’s under these conditions that we’re expecting a weaker Q2 GDP outturn than the strong prints over the summer period.
All content is general commentary, research and information only and isn’t financial or investment advice. This information doesn’t take into account your objectives, financial situation or needs, and its contents shouldn’t be relied on or used as a basis for entering into any products described in it. The views expressed are those of the authors and are based on information reasonably believed but not warranted to be or remain correct. Any views or information, while given in good faith, aren’t necessarily the views of Kiwibank Limited and are given with an express disclaimer of responsibility. Except where contrary to law, Kiwibank and its related entities aren’t liable for the information and no right of action shall arise or can be taken against any of the authors, Kiwibank Limited or its employees either directly or indirectly as a result of any views expressed from this information.